SunTrust 2013 Annual Report Download - page 73
Download and view the complete annual report
Please find page 73 of the 2013 SunTrust annual report below. You can navigate through the pages in the report by either clicking on the pages listed below, or by using the keyword search tool below to find specific information within the annual report.-
 1
1 -
2
-
3
-
4
-
5
-
6
-
7
-
8
-
9
-
10
-
11
-
12
-
13
-
14
-
15
-
16
-
17
-
18
-
19
-
20
-
21
-
22
-
23
-
24
-
25
-
26
-
27
-
28
-
29
-
30
-
31
-
32
-
33
-
34
-
35
-
36
-
37
-
38
-
39
-
40
-
41
-
42
-
43
-
44
-
45
-
46
-
47
-
48
-
49
-
50
-
51
-
52
-
53
-
54
-
55
-
56
-
57
-
58
-
59
-
60
-
61
-
62
-
 63
63 -
 64
64 -
 65
65 -
 66
66 -
 67
67 -
 68
68 -
 69
69 -
 70
70 -
 71
71 -
 72
72 -
 73
73 -
 74
74 -
 75
75 -
 76
76 -
 77
77 -
 78
78 -
 79
79 -
 80
80 -
 81
81 -
 82
82 -
 83
83 -
84
-
85
-
86
-
87
-
88
-
89
-
90
-
91
-
92
-
93
-
94
-
95
-
96
-
97
-
98
-
99
-
100
-
101
-
102
-
103
-
104
-
105
-
106
-
107
-
108
-
109
-
110
-
111
-
112
-
113
-
114
-
115
-
116
-
117
-
118
-
119
-
120
-
121
-
122
-
123
-
124
-
125
-
126
-
127
-
128
-
129
-
130
-
131
-
132
-
133
-
134
-
135
-
136
-
137
-
138
-
139
-
140
-
141
-
142
-
143
-
144
-
145
-
146
-
147
-
148
-
149
-
150
-
151
-
152
-
153
-
154
-
155
-
156
-
157
-
158
-
159
-
160
-
161
-
162
-
163
-
164
-
165
-
166
-
167
-
168
-
169
-
170
-
171
-
172
-
173
-
174
-
175
-
176
-
177
-
178
-
179
-
180
-
181
-
182
-
183
-
184
-
185
-
186
-
187
-
188
-
189
-
190
-
191
-
192
-
193
-
194
-
195
-
196
-
197
-
198
-
199
-
200
-
201
-
202
-
203
-
204
-
205
-
206
-
207
-
208
-
209
-
210
-
211
-
212
-
213
-
214
-
215
-
216
-
217
-
218
-
219
-
220
-
221
-
222
-
223
-
224
-
225
-
226
-
227
-
228
-
229
-
230
-
231
-
232
-
233
-
234
-
235
-
236
 |
 |
57
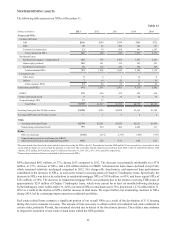
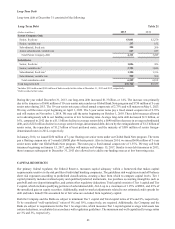
SELECTED FINANCIAL INSTRUMENTS CARRIED AT FAIR VALUE
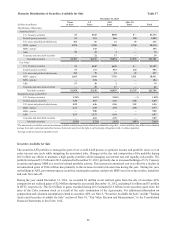
The following is a discussion of the more significant financial assets and financial liabilities that are currently carried at fair
value on the Consolidated Balance Sheets at December 31, 2013 and 2012. For a complete discussion of our fair value elections
and the methodologies used to estimate the fair values of our financial instruments, see Note 18, “Fair Value Election and
Measurement,” to the Consolidated Financial Statements in this Form 10-K.
Trading Assets and Liabilities and Derivatives Table 15
December 31
(Dollars in millions) 2013 2012
Trading Assets and Derivatives:
U.S. Treasury securities $219 $111
Federal agency securities 426 462
U.S. states and political subdivisions 65 34
MBS - agency 323 432
CDO/CLO securities 57 55
ABS 636
Corporate and other debt securities 534 567
CP 29 28
Equity securities 109 100
Derivatives 1, 2 1,384 2,083
Trading loans 31,888 2,319
Total trading assets and derivatives $5,040 $6,227
Trading Liabilities and Derivatives:
U.S. Treasury securities $472 $582
Corporate and other debt securities 179 173
Equity securities 59
Derivatives 1, 2 525 412
Total trading liabilities and derivatives $1,181 $1,176
1 Certain derivative assets of $37 million and derivative liabilities of $49 million are presented in trading assets and derivatives and trading liabilities and
derivatives, respectively, at December 31, 2013. Previously, these derivative assets and liabilities were presented in other assets and other liabilities,
respectively, in the Consolidated Balance Sheets. For comparative purposes, $178 million of derivative assets and $15 million of derivative liabilities have
been reclassified to trading assets and derivatives and trading liabilities and derivatives, respectively, at December 31, 2012.
2 Amounts include the impact of offsetting cash collateral received from and paid to the same derivative counterparties and the impact of netting derivative
assets and derivative liabilities when a legally enforceable master netting agreement or similar agreement exists.
3 Includes loans related to TRS.
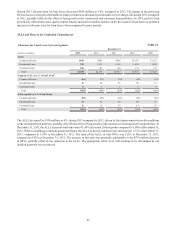
Trading Assets and Liabilities and Derivatives
Trading assets and derivative assets decreased $1.2 billion, or 19%, compared to December 31, 2012, primarily due to decreases
in net derivatives resulting from the interest rate environment and a reduction in TRS trading loans. Trading liabilities and
derivative liabilities remained relatively unchanged compared to December 31, 2012. An increase in net derivatives was offset
by a decrease in U.S. Treasury securities, as a result of normal business activity. See Note 16, "Derivative Financial
Instruments," to the Consolidated Financial Statements in this Form 10-K for additional information on derivatives.