SunTrust 2013 Annual Report Download - page 106
Download and view the complete annual report
Please find page 106 of the 2013 SunTrust annual report below. You can navigate through the pages in the report by either clicking on the pages listed below, or by using the keyword search tool below to find specific information within the annual report.-
 1
1 -
2
-
3
-
4
-
5
-
6
-
7
-
8
-
9
-
10
-
11
-
12
-
13
-
14
-
15
-
16
-
17
-
18
-
19
-
20
-
21
-
22
-
23
-
24
-
25
-
26
-
27
-
28
-
29
-
30
-
31
-
32
-
33
-
34
-
35
-
36
-
37
-
38
-
39
-
40
-
41
-
42
-
43
-
44
-
45
-
46
-
47
-
48
-
49
-
50
-
51
-
52
-
53
-
54
-
55
-
56
-
57
-
58
-
59
-
60
-
61
-
62
-
63
-
64
-
65
-
66
-
67
-
68
-
69
-
70
-
71
-
72
-
73
-
74
-
75
-
76
-
77
-
78
-
79
-
80
-
81
-
82
-
83
-
84
-
85
-
86
-
87
-
88
-
89
-
90
-
91
-
92
-
93
-
94
-
95
-
 96
96 -
 97
97 -
 98
98 -
 99
99 -
 100
100 -
 101
101 -
 102
102 -
 103
103 -
 104
104 -
 105
105 -
 106
106 -
 107
107 -
 108
108 -
 109
109 -
 110
110 -
 111
111 -
 112
112 -
 113
113 -
 114
114 -
 115
115 -
 116
116 -
117
-
118
-
119
-
120
-
121
-
122
-
123
-
124
-
125
-
126
-
127
-
128
-
129
-
130
-
131
-
132
-
133
-
134
-
135
-
136
-
137
-
138
-
139
-
140
-
141
-
142
-
143
-
144
-
145
-
146
-
147
-
148
-
149
-
150
-
151
-
152
-
153
-
154
-
155
-
156
-
157
-
158
-
159
-
160
-
161
-
162
-
163
-
164
-
165
-
166
-
167
-
168
-
169
-
170
-
171
-
172
-
173
-
174
-
175
-
176
-
177
-
178
-
179
-
180
-
181
-
182
-
183
-
184
-
185
-
186
-
187
-
188
-
189
-
190
-
191
-
192
-
193
-
194
-
195
-
196
-
197
-
198
-
199
-
200
-
201
-
202
-
203
-
204
-
205
-
206
-
207
-
208
-
209
-
210
-
211
-
212
-
213
-
214
-
215
-
216
-
217
-
218
-
219
-
220
-
221
-
222
-
223
-
224
-
225
-
226
-
227
-
228
-
229
-
230
-
231
-
232
-
233
-
234
-
235
-
236
 |
 |
90
decreased 13 basis points. Average deposit balances were essentially flat; however, favorable deposit mix trends continued
as lower cost average deposit balances increased, offsetting a $2.4 billion, or 16%, decline in average time deposits. Other
funding costs related to other assets improved by $29 million, driven primarily by a decline in funding rates.
Provision for credit losses was $362 million during 2013, a decrease of $283 million, or 44%, compared to 2012. The decrease
was driven by declines in net charge-offs of $211 million in home equity lines and $41 million in consumer mortgage loans.
Net charge-offs during 2012 included $43 million related to a change in policy which accelerated the timing for charging-off
junior lien loans and $31 million related to a change in policy regarding loans discharged in Chapter 7 bankruptcy.
Total noninterest income was $1.5 billion during 2013, a decrease of $20 million, or 1%, compared to 2012. The decrease
was largely driven by the reclassification of certain card rewards costs to offset related revenue and declines in service charges
on deposit account fees. These declines were partially offset by increases in wealth management revenue.
Total noninterest expense was $2.8 billion during 2013, a decrease of $291 million, or 9%, compared to 2012. The decrease
was driven by reductions in staff expense, other operating expenses, and overhead costs. These declines were partially the
result of a more efficient branch network and staffing model resulting from reducing the number of branches by 7% compared
to last year, as we made progress in our efforts to better align our distribution channels with evolving client preferences.
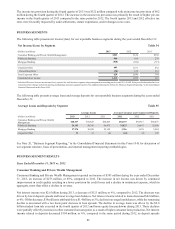
Wholesale Banking
Wholesale Banking reported net income of $900 million during the year ended December 31, 2013, an increase of $202
million, or 29%, compared to 2012. The increase in net income was attributable to decreases in provision for credit losses and
noninterest expense and an increase in net interest income, partially offset by a decrease in noninterest income.
Net interest income was $1.7 billion during 2013, a $72 million, or 4%, increase compared to 2012, driven by an increase in
average loan and deposit balances. Net interest income related to loans increased, as average loan balances increased $3.5
billion, or 7%, driven by increases in commercial tax-exempt, domestic, and floor plans loans. Net interest income related to
client deposits increased as average deposit balances increased $1.1 billion, or 3%, compared to the prior year. Favorable
trends in deposit mix continued as lower cost demand deposits increased $514 million, or 3%, average interest-bearing
transaction accounts and money market accounts increased a combined $805 million, or 5%, and time deposits decreased
$190 million, or 17%.
Provision for credit losses was $79 million during 2013, a decrease of $187 million, or 70%, compared to 2012. The decrease
was driven by declines in CRE, commercial, and residential mortgage loans net charge-offs.
Total noninterest income was $1.3 billion during 2013, a decrease of $123 million, or 9%, compared to 2012, driven by lower
trading revenue and the impairment of certain lease financing assets during 2013. These declines were partially offset by gains
on the disposition of affordable housing partnership assets and higher investment banking fees.
Total noninterest expense was $1.6 billion during 2013, a decrease of $172 million, or 10%, compared to 2012, driven by
continued declines in other real estate related expense and other credit related expense. These declines were partially offset
by increased operating losses as 2012 included the impact of the favorable settlement of litigation claims. Additionally, the
prior year included a $96 million impairment charge related to the planned dispositions of affordable housing partnership
assets that were substantially completed during 2013.
Mortgage Banking
Mortgage Banking reported a net loss of $568 million during the year ended December 31, 2013, an improvement of $128
million, or 18%, compared to 2012. The improvement was driven by a lower provision for mortgage repurchases and lower
provision for credit losses. These improvements were partially offset by a decrease in mortgage production related and servicing
income and an increase in noninterest expense primarily attributable to the recognition of certain legacy mortgage matters.
Net interest income was $539 million during 2013, an increase of $27 million, or 5%, compared to 2012. The increase was
predominantly due to higher net interest income on loans that was partially offset by lower deposit net interest income and
net interest income on LHFS. Net interest income on loans increased $46 million, or 14%, due to improved spreads on
residential mortgages, as well as nonaccrual and restructured loans. However, average residential mortgage loans decreased
$1.5 billion, or 6%, which partially offset the improved spreads. Net interest income on deposits decreased $10 million due
to a $432 million decrease, or 12%, in total average deposits. Net interest income on LHFS decreased $9 million due to lower
loan spreads, coupled with a $207 million decrease in average balances.