SunTrust 2013 Annual Report Download - page 150
Download and view the complete annual report
Please find page 150 of the 2013 SunTrust annual report below. You can navigate through the pages in the report by either clicking on the pages listed below, or by using the keyword search tool below to find specific information within the annual report.-
 1
1 -
2
-
3
-
4
-
5
-
6
-
7
-
8
-
9
-
10
-
11
-
12
-
13
-
14
-
15
-
16
-
17
-
18
-
19
-
20
-
21
-
22
-
23
-
24
-
25
-
26
-
27
-
28
-
29
-
30
-
31
-
32
-
33
-
34
-
35
-
36
-
37
-
38
-
39
-
40
-
41
-
42
-
43
-
44
-
45
-
46
-
47
-
48
-
49
-
50
-
51
-
52
-
53
-
54
-
55
-
56
-
57
-
58
-
59
-
60
-
61
-
62
-
63
-
64
-
65
-
66
-
67
-
68
-
69
-
70
-
71
-
72
-
73
-
74
-
75
-
76
-
77
-
78
-
79
-
80
-
81
-
82
-
83
-
84
-
85
-
86
-
87
-
88
-
89
-
90
-
91
-
92
-
93
-
94
-
95
-
96
-
97
-
98
-
99
-
100
-
101
-
102
-
103
-
104
-
105
-
106
-
107
-
108
-
109
-
110
-
111
-
112
-
113
-
114
-
115
-
116
-
117
-
118
-
119
-
120
-
121
-
122
-
123
-
124
-
125
-
126
-
127
-
128
-
129
-
130
-
131
-
132
-
133
-
134
-
135
-
136
-
137
-
138
-
139
-
 140
140 -
 141
141 -
 142
142 -
 143
143 -
 144
144 -
 145
145 -
 146
146 -
 147
147 -
 148
148 -
 149
149 -
 150
150 -
 151
151 -
 152
152 -
 153
153 -
 154
154 -
 155
155 -
 156
156 -
 157
157 -
 158
158 -
 159
159 -
 160
160 -
161
-
162
-
163
-
164
-
165
-
166
-
167
-
168
-
169
-
170
-
171
-
172
-
173
-
174
-
175
-
176
-
177
-
178
-
179
-
180
-
181
-
182
-
183
-
184
-
185
-
186
-
187
-
188
-
189
-
190
-
191
-
192
-
193
-
194
-
195
-
196
-
197
-
198
-
199
-
200
-
201
-
202
-
203
-
204
-
205
-
206
-
207
-
208
-
209
-
210
-
211
-
212
-
213
-
214
-
215
-
216
-
217
-
218
-
219
-
220
-
221
-
222
-
223
-
224
-
225
-
226
-
227
-
228
-
229
-
230
-
231
-
232
-
233
-
234
-
235
-
236
 |
 |

Notes to Consolidated Financial Statements, continued
134
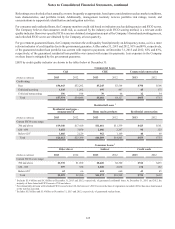
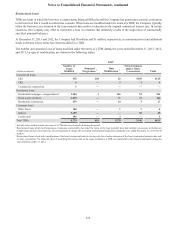
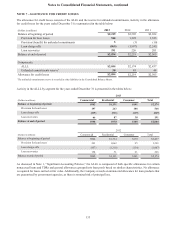
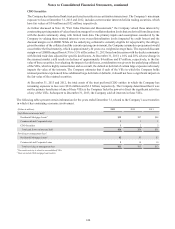
The Company’s LHFI portfolio and related ALLL is shown in the tables below:
December 31, 2013
Commercial Residential Consumer Total
(Dollars in millions)
Carrying
Val u e
Associated
ALLL
Carrying
Val u e
Associated
ALLL
Carrying
Val u e
Associated
ALLL
Carrying
Val u e
Associated
ALLL
Individually evaluated $171 $10 $2,878 $345 $110 $8 $3,159 $363
Collectively evaluated 64,139 936 40,010 585 20,267 160 124,416 1,681
Total evaluated 64,310 946 42,888 930 20,377 168 127,575 2,044
LHFI at fair value — — 302 — — — 302 —
Total LHFI $64,310 $946 $43,190 $930 $20,377 $168 $127,877 $2,044
December 31, 2012
Commercial Residential Consumer Total
(Dollars in millions)
Carrying
Value
Associated
ALLL
Carrying
Value
Associated
ALLL
Carrying
Value
Associated
ALLL
Carrying
Value
Associated
ALLL
Individually evaluated $138 $7 $2,859 $348 $81 $9 $3,078 $364
Collectively evaluated 58,750 895 39,961 783 19,302 132 118,013 1,810
Total evaluated 58,888 902 42,820 1,131 19,383 141 121,091 2,174
LHFI at fair value — — 379 — — — 379 —
Total LHFI $58,888 $902 $43,199 $1,131 $19,383 $141 $121,470 $2,174
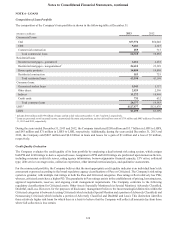
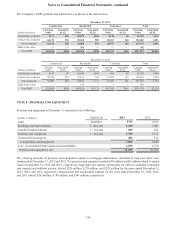
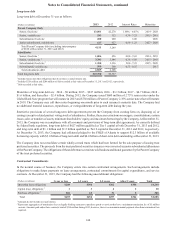
NOTE 8 - PREMISES AND EQUIPMENT
Premises and equipment at December 31 consisted of the following:
(Dollars in millions) Useful Life 2013 2012
Land Indefinite $345 $349
Buildings and improvements 2 - 40 years 1,045 1,041
Leasehold improvements 1 - 30 years 609 622
Furniture and equipment 1 - 20 years 1,399 1,357
Construction in progress 206 111
Total premises and equipment 3,604 3,480
Less: Accumulated depreciation and amortization 2,039 1,916
Premises and equipment, net $1,565 $1,564
The carrying amounts of premises and equipment subject to mortgage indebtedness (included in long-term debt) were
immaterial at December 31, 2013 and 2012. Net premises and equipment included $5 million and $6 million related to capital
leases at December 31, 2013 and 2012, respectively. Aggregate rent expense (principally for offices), including contingent
rent expense and sublease income, totaled $220 million, $228 million, and $225 million for the years ended December 31,
2013, 2012, and 2011, respectively. Depreciation and amortization expense for the years ended December 31, 2013, 2012,
and 2011 totaled $185 million, $188 million, and $181 million, respectively.