SunTrust 2013 Annual Report Download - page 198
Download and view the complete annual report
Please find page 198 of the 2013 SunTrust annual report below. You can navigate through the pages in the report by either clicking on the pages listed below, or by using the keyword search tool below to find specific information within the annual report.-
 1
1 -
2
-
3
-
4
-
5
-
6
-
7
-
8
-
9
-
10
-
11
-
12
-
13
-
14
-
15
-
16
-
17
-
18
-
19
-
20
-
21
-
22
-
23
-
24
-
25
-
26
-
27
-
28
-
29
-
30
-
31
-
32
-
33
-
34
-
35
-
36
-
37
-
38
-
39
-
40
-
41
-
42
-
43
-
44
-
45
-
46
-
47
-
48
-
49
-
50
-
51
-
52
-
53
-
54
-
55
-
56
-
57
-
58
-
59
-
60
-
61
-
62
-
63
-
64
-
65
-
66
-
67
-
68
-
69
-
70
-
71
-
72
-
73
-
74
-
75
-
76
-
77
-
78
-
79
-
80
-
81
-
82
-
83
-
84
-
85
-
86
-
87
-
88
-
89
-
90
-
91
-
92
-
93
-
94
-
95
-
96
-
97
-
98
-
99
-
100
-
101
-
102
-
103
-
104
-
105
-
106
-
107
-
108
-
109
-
110
-
111
-
112
-
113
-
114
-
115
-
116
-
117
-
118
-
119
-
120
-
121
-
122
-
123
-
124
-
125
-
126
-
127
-
128
-
129
-
130
-
131
-
132
-
133
-
134
-
135
-
136
-
137
-
138
-
139
-
140
-
141
-
142
-
143
-
144
-
145
-
146
-
147
-
148
-
149
-
150
-
151
-
152
-
153
-
154
-
155
-
156
-
157
-
158
-
159
-
160
-
161
-
162
-
163
-
164
-
165
-
166
-
167
-
168
-
169
-
170
-
171
-
172
-
173
-
174
-
175
-
176
-
177
-
178
-
179
-
180
-
181
-
182
-
183
-
184
-
185
-
186
-
187
-
 188
188 -
 189
189 -
 190
190 -
 191
191 -
 192
192 -
 193
193 -
 194
194 -
 195
195 -
 196
196 -
 197
197 -
 198
198 -
 199
199 -
 200
200 -
 201
201 -
 202
202 -
 203
203 -
 204
204 -
 205
205 -
 206
206 -
 207
207 -
 208
208 -
209
-
210
-
211
-
212
-
213
-
214
-
215
-
216
-
217
-
218
-
219
-
220
-
221
-
222
-
223
-
224
-
225
-
226
-
227
-
228
-
229
-
230
-
231
-
232
-
233
-
234
-
235
-
236
 |
 |
Notes to Consolidated Financial Statements, continued
182
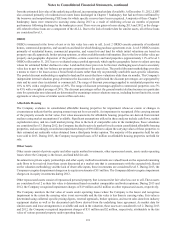
with the issuer at par and cannot be traded in the market; as such, no significant observable market data for these
instruments is available.
Commercial Paper
From time to time, the Company trades third party CP that is generally short-term in nature (less than 30 days) and
highly rated. The Company estimates the fair value of this CP based on observable pricing from executed trades of
similar instruments; thus, CP is classified as level 2.
Equity securities
Level 3 equity securities classified as securities AFS include FHLB stock and Federal Reserve Bank stock, which
are redeemable with the issuer at cost and cannot be traded in the market. As such, no significant observable market
data for these instruments is available. The Company accounts for the stock based on industry guidance that requires
these investments be carried at cost and evaluated for impairment based on the ultimate recovery of cost.
Derivative contracts
The Company holds derivative instruments used for both trading purposes and risk management purposes.
Level 1 derivative contracts generally include exchange-traded futures or option contracts for which pricing is readily
available. The Company’s level 2 instruments are predominantly standard OTC swaps, options, and forwards, with
underlying market variables of interest rates, foreign exchange, equity, and credit. Because fair values for OTC
contracts are not readily available, the Company estimates fair values using internal, but standard, valuation models
that incorporate market-observable inputs. The valuation model is driven by the type of contract: for option-based
products, the Company uses an appropriate option pricing model, such as Black-Scholes; for forward-based products,
the Company’s valuation methodology is generally a discounted cash flow approach. The primary drivers of the fair
values of derivative instruments are the underlying variables, such as interest rates, exchange rates, equity, or credit.
As such, the Company uses market-based assumptions for all of its significant inputs, such as interest rate yield
curves, quoted exchange rates and spot prices, market implied volatilities, and credit curves.
Level 2 derivative instruments are primarily transacted in the institutional dealer market and priced with observable
market assumptions at a mid-market valuation point, with appropriate valuation adjustments for liquidity and credit
risk. For purposes of valuation adjustments to its derivative positions, the Company has evaluated liquidity premiums
that may be demanded by market participants, as well as the credit risk of its counterparties and its own credit. The
Company has considered factors such as the likelihood of default by itself and its counterparties, its net exposures,
and remaining maturities in determining the appropriate fair value adjustments to record. Generally, the expected
loss of each counterparty is estimated using the Company's proprietary internal risk rating system. The risk rating
system utilizes counterparty-specific probabilities of default and LGD estimates to derive the expected loss. For
counterparties that are rated by national rating agencies, those ratings are also considered in estimating the credit
risk. In addition, counterparty exposure is evaluated by netting positions that are subject to master netting
arrangements, as well as considering the amount of marketable collateral securing the position. Specifically approved
counterparties and exposure limits are defined. Creditworthiness of the approved counterparties is regularly reviewed
and appropriate business action is taken to adjust the exposure to certain counterparties, as necessary. This approach
used to estimate exposures to counterparties is also used by the Company to estimate its own credit risk on derivative
liability positions. See Note 16, “Derivative Financial Instruments,” for additional information on the Company's
derivative contracts.
The Company's level 3 derivatives include IRLCs that satisfy the criteria to be treated as derivative financial
instruments. The fair value of IRLCs on residential LHFS, while based on interest rates observable in the market, is
highly dependent on the ultimate closing of the loans. These “pull-through” rates are based on the Company’s historical
data and reflect the Company’s best estimate of the likelihood that a commitment will ultimately result in a closed
loan. As pull-through rates increase, the fair value of IRLCs also increases. Servicing value is included in the fair
value of IRLCs, and the fair value of servicing is determined by projecting cash flows which are then discounted to
estimate an expected fair value. The fair value of servicing is impacted by a variety of factors, including prepayment
assumptions, discount rates, delinquency rates, contractually specified servicing fees, servicing costs, and underlying
portfolio characteristics. Because these inputs are not transparent in market trades, IRLCs are considered to be level
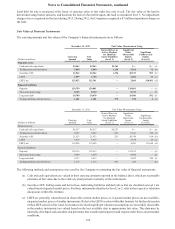
3 assets. During the years ended December 31, 2013 and 2012, the Company transferred $222 million and $882
million, respectively, of IRLCs out of level 3 as the associated loans were closed.
Trading loans
The Company engages in certain businesses whereby the election to carry loans at fair value for financial reporting
aligns with the underlying business purpose. Specifically, the loans that are included within this classification are:
(i) loans made or acquired in connection with the Company’s TRS business (see Note 10, "Certain Transfers of