SunTrust 2013 Annual Report Download - page 61
Download and view the complete annual report
Please find page 61 of the 2013 SunTrust annual report below. You can navigate through the pages in the report by either clicking on the pages listed below, or by using the keyword search tool below to find specific information within the annual report.-
 1
1 -
2
-
3
-
4
-
5
-
6
-
7
-
8
-
9
-
10
-
11
-
12
-
13
-
14
-
15
-
16
-
17
-
18
-
19
-
20
-
21
-
22
-
23
-
24
-
25
-
26
-
27
-
28
-
29
-
30
-
31
-
32
-
33
-
34
-
35
-
36
-
37
-
38
-
39
-
40
-
41
-
42
-
43
-
44
-
45
-
46
-
47
-
48
-
49
-
50
-
 51
51 -
 52
52 -
 53
53 -
 54
54 -
 55
55 -
 56
56 -
 57
57 -
 58
58 -
 59
59 -
 60
60 -
 61
61 -
 62
62 -
 63
63 -
 64
64 -
 65
65 -
 66
66 -
 67
67 -
 68
68 -
 69
69 -
 70
70 -
 71
71 -
72
-
73
-
74
-
75
-
76
-
77
-
78
-
79
-
80
-
81
-
82
-
83
-
84
-
85
-
86
-
87
-
88
-
89
-
90
-
91
-
92
-
93
-
94
-
95
-
96
-
97
-
98
-
99
-
100
-
101
-
102
-
103
-
104
-
105
-
106
-
107
-
108
-
109
-
110
-
111
-
112
-
113
-
114
-
115
-
116
-
117
-
118
-
119
-
120
-
121
-
122
-
123
-
124
-
125
-
126
-
127
-
128
-
129
-
130
-
131
-
132
-
133
-
134
-
135
-
136
-
137
-
138
-
139
-
140
-
141
-
142
-
143
-
144
-
145
-
146
-
147
-
148
-
149
-
150
-
151
-
152
-
153
-
154
-
155
-
156
-
157
-
158
-
159
-
160
-
161
-
162
-
163
-
164
-
165
-
166
-
167
-
168
-
169
-
170
-
171
-
172
-
173
-
174
-
175
-
176
-
177
-
178
-
179
-
180
-
181
-
182
-
183
-
184
-
185
-
186
-
187
-
188
-
189
-
190
-
191
-
192
-
193
-
194
-
195
-
196
-
197
-
198
-
199
-
200
-
201
-
202
-
203
-
204
-
205
-
206
-
207
-
208
-
209
-
210
-
211
-
212
-
213
-
214
-
215
-
216
-
217
-
218
-
219
-
220
-
221
-
222
-
223
-
224
-
225
-
226
-
227
-
228
-
229
-
230
-
231
-
232
-
233
-
234
-
235
-
236
 |
 |
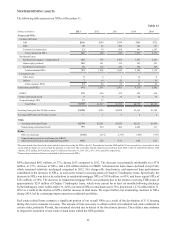
45
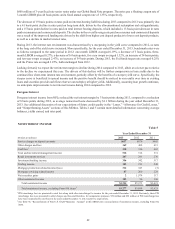
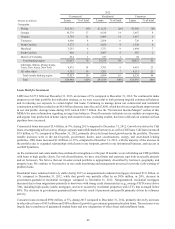
than in 2013. Benefits expense decreased in part due to lower 401(k) expense, medical costs, and pension expense in 2013
compared to 2012.
Outside processing and software increased $36 million, or 5%, during 2013 compared to 2012. The increase was primarily
due to increased utilization of outsourced services.
Operating losses increased $226 million, or 82%, compared to 2012, due to specific mortgage-related legal matters that were
recognized in 2013. Excluding items included in the Form 8-K in 2013, which included $323 million related to these matters
in 2013, operating losses decreased by 35% from 2012 due to declines related to mortgage-related regulatory and legal matters.
Specifically in 2013, we reached agreements in principle with the HUD and the U.S. DOJ (collectively, the "Government")
to settle certain civil and administrative claims related to our origination of FHA-insured mortgage loans and our portion of
the National Mortgage Servicing Settlement, which pertains to mortgage servicing and origination practices. We are continuing
to negotiate definitive settlement terms for each of these matters but have certain substantive disagreements with some of the
positions being taken by the Government. We may be unable to resolve our disagreements with the Government and may not
reach a definitive settlement agreement as it relates to the FHA matter. While our 2013 results reflect the estimated cost of
resolving these matters, we face several risks from these settlements, including being unable to reach definitive settlement
agreements reflecting the terms of the agreements in principle and being unable to meet certain consumer relief commitments,
resulting in increased costs to resolve these matters. Also, we are not able to predict the effect that a failure to resolve the
FHA matter will have on the agreement in principle to settle the alleged claims regarding our mortgage servicing and origination
practices. See further discussion of these matters in Note 19, "Contingencies," to the Consolidated Financial Statements and
Part I., "Item 1A. Risk Factors," in this Form 10-K.
Credit and collection services expense increased $25 million, or 10%, compared to 2012, primarily due to an increase in the
mortgage servicing advance reserve during 2013. We increased the reserve as a result of an expanded review of our servicing
advance practices and the sale of MSRs on approximately $1 billion in UPBs of predominantly delinquent mortgage loans.
As a result of the review of servicing advances and the MSR sale, we refined our loss estimates and valuation methodologies
to incorporate loss estimates on all advances while the prior methodology centered on aged advances. This $96 million reserve
increase was part of the Form 8-K items in 2013 and, when excluding these items, credit and collection services expense
decreased 30% from 2012, primarily due to declines in credit and collection costs as a result of the significant decline in
average NPAs during 2013.
Other real estate expense decreased $136 million, or 97%, compared to 2012. The decrease was predominantly due to a decline
in valuation losses and an increase in gains on sales. It is unlikely that gains will continue to largely offset expenses, so future
expenses may increase from the current level, but as the economic environment improves over time, we expect that other real
estate expense will continue to be notably lower than the elevated levels during 2011 and 2012. During 2014, we expect
modest aggregate declines in cyclical costs (which includes operating losses, other real estate expense, and credit and collection
services) compared to 2013; however, operating losses can be volatile and could impact those expectations.
Regulatory assessments decreased $52 million, or 22%, compared to 2012, due to declines in our FDIC insurance assessment
rate, reflecting our reduced risk profile. Partially offsetting the decrease were additional regulatory supervisory fees imposed
on large institutions during 2013. Marketing and customer development expense decreased $49 million, or 27%, compared
to 2012, primarily as a result of our charitable contribution during 2012 of previously owned Coke shares. Other staff expense
decreased $28 million, or 30%, compared to 2012, driven by declines in severance expenses compared to 2012.
Consulting and legal expenses decreased $92 million, or 56%, compared to 2012, predominantly due to the elimination of
certain expenses associated with the Independent Foreclosure Review that was part of the Consent Order. We entered into an
Amendment to the Consent Order in February 2013 that allowed us to begin eliminating consulting and legal costs of
independent third parties providing file review, borrower outreach, and legal services associated with the Consent Order
foreclosure file review. For additional information regarding the Consent Order and the Amendment, see Note 19,
“Contingencies,” to the Consolidated Financial Statements in this Form 10-K.
Amortization/impairment of intangible assets/goodwill decreased $23 million, or 50%, compared to 2012. The decrease was
partially due to a $7 million goodwill impairment related to GenSpring in 2012. The remaining $16 million decrease in
amortization expense is due to a decrease in the core deposit and other intangible asset balances subject to amortization.
Affordable housing impairment decreased $93 million, or 97%, compared to 2012, driven by the $96 million write-down
recognized in 2012, upon the decision to market certain affordable housing investments for sale. Most of these consolidated
affordable housing properties have been sold with resulting gains included in other noninterest income. Marketing efforts
continue on the remaining properties to be sold with an anticipated sale during 2014. At December 31, 2013, market indicators