SunTrust 2013 Annual Report Download - page 88
Download and view the complete annual report
Please find page 88 of the 2013 SunTrust annual report below. You can navigate through the pages in the report by either clicking on the pages listed below, or by using the keyword search tool below to find specific information within the annual report.-
 1
1 -
2
-
3
-
4
-
5
-
6
-
7
-
8
-
9
-
10
-
11
-
12
-
13
-
14
-
15
-
16
-
17
-
18
-
19
-
20
-
21
-
22
-
23
-
24
-
25
-
26
-
27
-
28
-
29
-
30
-
31
-
32
-
33
-
34
-
35
-
36
-
37
-
38
-
39
-
40
-
41
-
42
-
43
-
44
-
45
-
46
-
47
-
48
-
49
-
50
-
51
-
52
-
53
-
54
-
55
-
56
-
57
-
58
-
59
-
60
-
61
-
62
-
63
-
64
-
65
-
66
-
67
-
68
-
69
-
70
-
71
-
72
-
73
-
74
-
75
-
76
-
77
-
 78
78 -
 79
79 -
 80
80 -
 81
81 -
 82
82 -
 83
83 -
 84
84 -
 85
85 -
 86
86 -
 87
87 -
 88
88 -
 89
89 -
 90
90 -
 91
91 -
 92
92 -
 93
93 -
 94
94 -
 95
95 -
 96
96 -
 97
97 -
 98
98 -
99
-
100
-
101
-
102
-
103
-
104
-
105
-
106
-
107
-
108
-
109
-
110
-
111
-
112
-
113
-
114
-
115
-
116
-
117
-
118
-
119
-
120
-
121
-
122
-
123
-
124
-
125
-
126
-
127
-
128
-
129
-
130
-
131
-
132
-
133
-
134
-
135
-
136
-
137
-
138
-
139
-
140
-
141
-
142
-
143
-
144
-
145
-
146
-
147
-
148
-
149
-
150
-
151
-
152
-
153
-
154
-
155
-
156
-
157
-
158
-
159
-
160
-
161
-
162
-
163
-
164
-
165
-
166
-
167
-
168
-
169
-
170
-
171
-
172
-
173
-
174
-
175
-
176
-
177
-
178
-
179
-
180
-
181
-
182
-
183
-
184
-
185
-
186
-
187
-
188
-
189
-
190
-
191
-
192
-
193
-
194
-
195
-
196
-
197
-
198
-
199
-
200
-
201
-
202
-
203
-
204
-
205
-
206
-
207
-
208
-
209
-
210
-
211
-
212
-
213
-
214
-
215
-
216
-
217
-
218
-
219
-
220
-
221
-
222
-
223
-
224
-
225
-
226
-
227
-
228
-
229
-
230
-
231
-
232
-
233
-
234
-
235
-
236
 |
 |
72
Loans
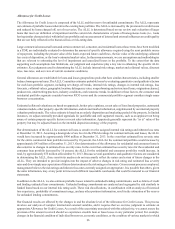
The fair values of LHFI and LHFS are based on observable current market prices in the secondary loan market in which loans
trade, as either whole loans or as ABS. When security prices are obtained in the secondary loan market, we will translate these
prices into whole loan prices by incorporating adjustments for estimated credit enhancement costs, loan servicing fees, and
various other transformation costs, when material. The fair value of a loan is impacted by the nature of the asset and the market
liquidity. Level 3 loans are predominantly mortgage loans that have been deemed not marketable, largely due to borrower
defaults or the identification of other loan defects. When estimating fair value for these loans, we use a discounted cash flow
approach based on assumptions that are generally not observable in the current markets, such as prepayment speeds, default
rates, loss severity rates, and liquidity discounts. Absent comparable current market data, we believe that the fair value derived
from these various approaches is a reasonable approximation of the prices that we would receive upon sale of the loans.
Other Intangible Assets and Other Assets
We record all MSRs at fair value on a recurring basis. The fair value of MSRs is based on discounted cash flow analyses and
can be highly variable quarter to quarter as market conditions and projected interest rates change. We provide disclosure of
the key economic assumptions used to measure MSRs and residual interests and a sensitivity analysis to adverse changes to
these assumptions in Note 9, “Goodwill and Other Intangible Assets,” to the Consolidated Financial Statements in this Form
10-K. This sensitivity analysis does not take into account hedging activities discussed in the “Other Market Risk” section of
this MD&A.
The fair values of OREO and other repossessed assets are typically determined based on recent appraisals by third parties
and other market information. Our OREO properties are concentrated in Georgia, Florida, and North Carolina. Further
deterioration in property values in those states or changes to our disposition strategies could cause our estimates of OREO
values to decline which would result in further write-downs. Estimates of fair value are also required when performing an
impairment analysis of goodwill, intangible assets, and long-lived assets. For long-lived assets, including intangible assets
subject to amortization, an impairment loss is recognized if the carrying amount of the asset is not recoverable and exceeds
its fair value. In determining the fair value, management uses models which require assumptions about growth rates, the life
of the asset, and/or the market value of the assets. We test long-lived assets for impairment whenever events or changes in
circumstances indicate that our carrying amount may not be recoverable.
Other Liabilities
The fair value methodology and assumptions related to our IRLCs are described in Note 18, “Fair Value Election and
Measurement,” to the Consolidated Financial Statements in this Form 10-K.
Goodwill
As of December 31, 2013 and 2012, our reporting units with goodwill balances were Consumer Banking and Private Wealth
Management, Wholesale Banking and Ridgeworth Capital Management. See Note 20, "Business Segment Reporting," to the
Consolidated Financial Statements in this Form 10-K for a further discussion of our reportable segments and changes that
occurred during 2013.
We review the goodwill of each reporting unit for impairment on an annual basis as of September 30, or more often, if events
or circumstances indicate that it is more likely than not that the fair value of the reporting unit is below the carrying value of
its equity. The goodwill impairment analysis estimates the fair value of equity using discounted cash flow analyses which
require assumptions, as well as guideline company and guideline transaction information, where available. The inputs and
assumptions specific to each reporting unit are incorporated in the valuations, including projections of future cash flows,
discount rates, the fair value of tangible assets and intangible assets and liabilities, and applicable valuation multiples based
on the guideline information. We assess the reasonableness of the estimated fair value of the reporting units by giving
consideration to our market capitalization over a reasonable period of time; however, supplemental information is applied
based on observable multiples from guideline companies, adjusted if necessary to reflect our specific factors, as well as current
market conditions. When the reporting unit is not a legal entity with a stand-alone equity balance, the carrying value of a
reporting unit is determined by allocating the total equity of the Company to each of its reporting units based on an equal
weighting of an approach based on regulatory risk-based capital and an approach based on tangible assets relative to tangible
equity. A portion of the Company’s equity is assigned to the Corporate Other operating segment, which is attributed to the
corporate assets and liabilities assigned to that segment that do not relate to the operations of any reporting unit. If the equity
in excess of regulatory capital requirements assigned to the Corporate Other operating segment was assigned to either the
Consumer Banking and Private Wealth Management or Wholesale Banking reporting unit, the fair value for each of those
reporting units would have remained in excess of its respective carrying value. Based on our annual impairment analysis of