SunTrust 2013 Annual Report Download - page 101
Download and view the complete annual report
Please find page 101 of the 2013 SunTrust annual report below. You can navigate through the pages in the report by either clicking on the pages listed below, or by using the keyword search tool below to find specific information within the annual report.-
 1
1 -
2
-
3
-
4
-
5
-
6
-
7
-
8
-
9
-
10
-
11
-
12
-
13
-
14
-
15
-
16
-
17
-
18
-
19
-
20
-
21
-
22
-
23
-
24
-
25
-
26
-
27
-
28
-
29
-
30
-
31
-
32
-
33
-
34
-
35
-
36
-
37
-
38
-
39
-
40
-
41
-
42
-
43
-
44
-
45
-
46
-
47
-
48
-
49
-
50
-
51
-
52
-
53
-
54
-
55
-
56
-
57
-
58
-
59
-
60
-
61
-
62
-
63
-
64
-
65
-
66
-
67
-
68
-
69
-
70
-
71
-
72
-
73
-
74
-
75
-
76
-
77
-
78
-
79
-
80
-
81
-
82
-
83
-
84
-
85
-
86
-
87
-
88
-
89
-
90
-
 91
91 -
 92
92 -
 93
93 -
 94
94 -
 95
95 -
 96
96 -
 97
97 -
 98
98 -
 99
99 -
 100
100 -
 101
101 -
 102
102 -
 103
103 -
 104
104 -
 105
105 -
 106
106 -
 107
107 -
 108
108 -
 109
109 -
 110
110 -
 111
111 -
112
-
113
-
114
-
115
-
116
-
117
-
118
-
119
-
120
-
121
-
122
-
123
-
124
-
125
-
126
-
127
-
128
-
129
-
130
-
131
-
132
-
133
-
134
-
135
-
136
-
137
-
138
-
139
-
140
-
141
-
142
-
143
-
144
-
145
-
146
-
147
-
148
-
149
-
150
-
151
-
152
-
153
-
154
-
155
-
156
-
157
-
158
-
159
-
160
-
161
-
162
-
163
-
164
-
165
-
166
-
167
-
168
-
169
-
170
-
171
-
172
-
173
-
174
-
175
-
176
-
177
-
178
-
179
-
180
-
181
-
182
-
183
-
184
-
185
-
186
-
187
-
188
-
189
-
190
-
191
-
192
-
193
-
194
-
195
-
196
-
197
-
198
-
199
-
200
-
201
-
202
-
203
-
204
-
205
-
206
-
207
-
208
-
209
-
210
-
211
-
212
-
213
-
214
-
215
-
216
-
217
-
218
-
219
-
220
-
221
-
222
-
223
-
224
-
225
-
226
-
227
-
228
-
229
-
230
-
231
-
232
-
233
-
234
-
235
-
236
 |
 |
85
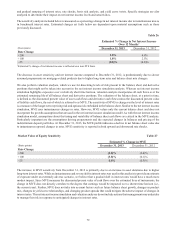
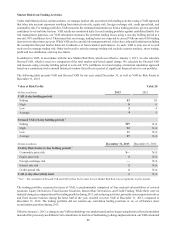
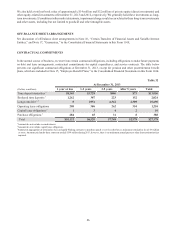
As presented below, we had an aggregate potential obligation of $64.1 billion to our clients in unused lines of credit at
December 31, 2013. Commitments to extend credit are arrangements to lend to clients who have complied with predetermined
contractual obligations. We also had $3.3 billion in letters of credit at December 31, 2013, most of which are standby letters
of credit, which require that we provide funding if certain future events occur. Approximately $1.4 billion of these letters
supported variable rate demand obligations at December 31, 2013. Unused commercial lines of credit have increased since
December 31, 2012, as we continued to provide credit availability to our clients, while mortgage commitments have decreased
significantly due to a decline in IRLC contracts as a result of rising interest rates during the year.
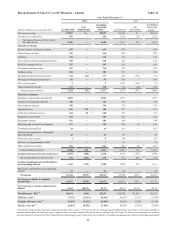
Unfunded Lending Commitments Table 31
(Dollars in millions) December 31, 2013 December 31, 2012
Unused lines of credit:
Commercial $43,444 $36,902
Mortgage commitments 12,722 9,152
Home equity lines 11,157 11,739
CRE 2,078 1,684
Credit card 4,708 4,075
Total unused lines of credit $64,109 $63,552
Letters of credit:
Financial standby $3,256 $3,993
Performance standby 57 49
Commercial 28 56
Total letters of credit $3,341 $4,098
1 Includes IRLC contracts with notional balances of $1.8 billion and $6.8 billion at December 31, 2013 and 2012, respectively.
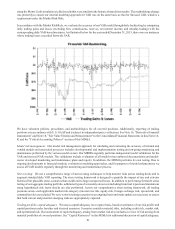
Other Market Risk
Other sources of market risk include the risk associated with holding residential and commercial mortgage loans prior to
selling them into the secondary market, commitments to clients to make mortgage loans that will be sold to the secondary
market, and our investment in MSRs. We manage the risks associated with the residential and commercial mortgage LHFS
(i.e., the warehouse) and our IRLCs on residential loans intended for sale. The warehouses and IRLCs consist primarily of
fixed and adjustable rate single family residential and CRE loans. The risk associated with the warehouses and IRLCs is the
potential change in interest rates between the time the customer locks the rate on the anticipated loan and the time the loan
is sold on the secondary market, which is typically 60-150 days.
We manage interest rate risk predominantly with interest rate swaps, futures, and forward sale agreements, where the changes
in value of the instruments substantially offset the changes in value of the warehouse and the IRLCs. The IRLCs on residential
mortgage loans intended for sale are classified as derivative financial instruments and are not designated as hedge accounting
relationships.
MSRs are the present value of future net cash flows that are expected to be received from the mortgage servicing portfolio.
The value of MSRs is highly dependent upon the assumed prepayment speed of the mortgage servicing portfolio, which is
driven by the level of certain key interest rates, primarily the 30-year current coupon par mortgage rate. Future expected net
cash flows from servicing a loan in the mortgage servicing portfolio would not be realized if the loan pays off earlier than
anticipated.
MSRs, which are carried at fair value, totaled $1.3 billion and $899 million at December 31, 2013 and 2012, respectively, are
managed within established risk limits, and are monitored as part of various governance processes. We originated MSRs with
fair values at the time of origination of $352 million and $336 million during 2013 and 2012, respectively, and recognized a
mark-to-market increase of $50 million and a decrease of $353 million in the fair value of our MSRs in 2013 and 2012,
respectively. Increases or decreases in fair value include the decay resulting from the realization of expected monthly net
servicing cash flows. We recorded $233 million and $69 million of net losses during 2013 and 2012, respectively, inclusive
of decay and related hedges. The increase in net losses related to MSRs during 2013 compared to 2012 was driven by a decline
in net hedge performance as a result of decreased carry income and an increase in market interest rate volatility, as well as a
modest increase in decay.