SunTrust 2013 Annual Report Download - page 78
Download and view the complete annual report
Please find page 78 of the 2013 SunTrust annual report below. You can navigate through the pages in the report by either clicking on the pages listed below, or by using the keyword search tool below to find specific information within the annual report.-
 1
1 -
2
-
3
-
4
-
5
-
6
-
7
-
8
-
9
-
10
-
11
-
12
-
13
-
14
-
15
-
16
-
17
-
18
-
19
-
20
-
21
-
22
-
23
-
24
-
25
-
26
-
27
-
28
-
29
-
30
-
31
-
32
-
33
-
34
-
35
-
36
-
37
-
38
-
39
-
40
-
41
-
42
-
43
-
44
-
45
-
46
-
47
-
48
-
49
-
50
-
51
-
52
-
53
-
54
-
55
-
56
-
57
-
58
-
59
-
60
-
61
-
62
-
63
-
64
-
65
-
66
-
67
-
 68
68 -
 69
69 -
 70
70 -
 71
71 -
 72
72 -
 73
73 -
 74
74 -
 75
75 -
 76
76 -
 77
77 -
 78
78 -
 79
79 -
 80
80 -
 81
81 -
 82
82 -
 83
83 -
 84
84 -
 85
85 -
 86
86 -
 87
87 -
 88
88 -
89
-
90
-
91
-
92
-
93
-
94
-
95
-
96
-
97
-
98
-
99
-
100
-
101
-
102
-
103
-
104
-
105
-
106
-
107
-
108
-
109
-
110
-
111
-
112
-
113
-
114
-
115
-
116
-
117
-
118
-
119
-
120
-
121
-
122
-
123
-
124
-
125
-
126
-
127
-
128
-
129
-
130
-
131
-
132
-
133
-
134
-
135
-
136
-
137
-
138
-
139
-
140
-
141
-
142
-
143
-
144
-
145
-
146
-
147
-
148
-
149
-
150
-
151
-
152
-
153
-
154
-
155
-
156
-
157
-
158
-
159
-
160
-
161
-
162
-
163
-
164
-
165
-
166
-
167
-
168
-
169
-
170
-
171
-
172
-
173
-
174
-
175
-
176
-
177
-
178
-
179
-
180
-
181
-
182
-
183
-
184
-
185
-
186
-
187
-
188
-
189
-
190
-
191
-
192
-
193
-
194
-
195
-
196
-
197
-
198
-
199
-
200
-
201
-
202
-
203
-
204
-
205
-
206
-
207
-
208
-
209
-
210
-
211
-
212
-
213
-
214
-
215
-
216
-
217
-
218
-
219
-
220
-
221
-
222
-
223
-
224
-
225
-
226
-
227
-
228
-
229
-
230
-
231
-
232
-
233
-
234
-
235
-
236
 |
 |

62
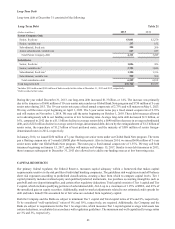
BORROWINGS
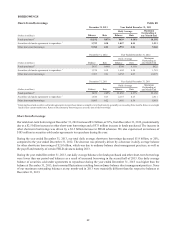
Short-Term Borrowings Table 20
December 31, 2013 Year Ended December 31, 2013
Balance Rate
Daily Average Maximum
Outstanding at
any Month-End
(Dollars in millions) Balance Rate
Funds purchased 1$1,192 0.07% $639 0.10% $1,192
Securities sold under agreements to repurchase 11,759 0.10 1,857 0.14 1,911
Other short-term borrowings 5,788 0.22 4,953 0.26 5,868
December 31, 2012 Year Ended December 31, 2012
Balance Rate
Daily Average Maximum
Outstanding at
any Month-End
(Dollars in millions) Balance Rate
Funds purchased 1$617 0.09% $798 0.11% $925
Securities sold under agreements to repurchase 11,574 0.18 1,602 0.18 1,781
Other short-term borrowings 3,303 0.31 6,952 0.27 10,697
December 31, 2011 Year Ended December 31, 2011
Balance Rate
Daily Average Maximum
Outstanding at
any Month-End
(Dollars in millions) Balance Rate
Funds purchased 1$839 0.09% $1,038 0.13% $1,169
Securities sold under agreements to repurchase 11,644 0.13 2,157 0.15 2,411
Other short-term borrowings 8,983 0.22 3,465 0.36 8,983
1 Funds purchased and securities sold under agreements to repurchase mature overnight or at a fixed maturity generally not exceeding three months. Rates on overnight
funds reflect current market rates. Rates on fixed maturity borrowings are set at the time of the borrowings.
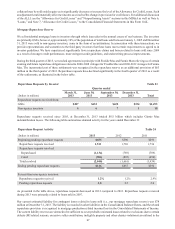
Short-Term Borrowings
Our total short-term borrowings at December 31, 2013 increased $3.2 billion, or 59%, from December 31, 2012, predominantly
due to a $2.5 billion increase in other short-term borrowings and a $575 million increase in funds purchased. The increase in
other short-term borrowings was driven by a $2.5 billion increase in FHLB advances. We also experienced an increase of
$185 million in securities sold under agreements to repurchase during the year.
During the year ended December 31, 2013, our total daily average short-term borrowings decreased $1.9 billion, or 20%,
compared to the year ended December 31, 2012. The decrease was primarily driven by a decrease in daily average balance
for other short-term borrowings of $2.0 billion, which was due to ordinary balance sheet management practices, as well as
the payoff and maturity of certain FHLB advances during 2013.
During the year ended December 31, 2013, our daily average balances for funds purchased and other short-term borrowings
were lower than our period-end balances as a result of increased borrowing in the second half of 2013. Our daily average
balance of securities sold under agreements to repurchase during the year ended December 31, 2013 was higher than the
balance at December 31, 2013, due to normal fluctuations resulting from ordinary balance sheet management practices. None
of our maximum outstanding balances at any month-end in 2013 were materially different than the respective balances at
December 31, 2013.