SunTrust 2013 Annual Report Download - page 110
Download and view the complete annual report
Please find page 110 of the 2013 SunTrust annual report below. You can navigate through the pages in the report by either clicking on the pages listed below, or by using the keyword search tool below to find specific information within the annual report.-
 1
1 -
2
-
3
-
4
-
5
-
6
-
7
-
8
-
9
-
10
-
11
-
12
-
13
-
14
-
15
-
16
-
17
-
18
-
19
-
20
-
21
-
22
-
23
-
24
-
25
-
26
-
27
-
28
-
29
-
30
-
31
-
32
-
33
-
34
-
35
-
36
-
37
-
38
-
39
-
40
-
41
-
42
-
43
-
44
-
45
-
46
-
47
-
48
-
49
-
50
-
51
-
52
-
53
-
54
-
55
-
56
-
57
-
58
-
59
-
60
-
61
-
62
-
63
-
64
-
65
-
66
-
67
-
68
-
69
-
70
-
71
-
72
-
73
-
74
-
75
-
76
-
77
-
78
-
79
-
80
-
81
-
82
-
83
-
84
-
85
-
86
-
87
-
88
-
89
-
90
-
91
-
92
-
93
-
94
-
95
-
96
-
97
-
98
-
99
-
 100
100 -
 101
101 -
 102
102 -
 103
103 -
 104
104 -
 105
105 -
 106
106 -
 107
107 -
 108
108 -
 109
109 -
 110
110 -
 111
111 -
 112
112 -
 113
113 -
 114
114 -
 115
115 -
 116
116 -
 117
117 -
 118
118 -
 119
119 -
 120
120 -
121
-
122
-
123
-
124
-
125
-
126
-
127
-
128
-
129
-
130
-
131
-
132
-
133
-
134
-
135
-
136
-
137
-
138
-
139
-
140
-
141
-
142
-
143
-
144
-
145
-
146
-
147
-
148
-
149
-
150
-
151
-
152
-
153
-
154
-
155
-
156
-
157
-
158
-
159
-
160
-
161
-
162
-
163
-
164
-
165
-
166
-
167
-
168
-
169
-
170
-
171
-
172
-
173
-
174
-
175
-
176
-
177
-
178
-
179
-
180
-
181
-
182
-
183
-
184
-
185
-
186
-
187
-
188
-
189
-
190
-
191
-
192
-
193
-
194
-
195
-
196
-
197
-
198
-
199
-
200
-
201
-
202
-
203
-
204
-
205
-
206
-
207
-
208
-
209
-
210
-
211
-
212
-
213
-
214
-
215
-
216
-
217
-
218
-
219
-
220
-
221
-
222
-
223
-
224
-
225
-
226
-
227
-
228
-
229
-
230
-
231
-
232
-
233
-
234
-
235
-
236
 |
 |
94
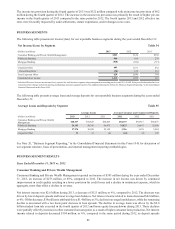
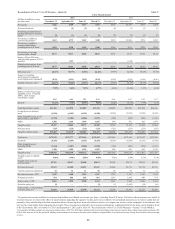
Net interest income was $393 million during 2012, a decrease of $111 million, or 22%, compared to 2011. The decrease was
primarily due to lower income from the aforementioned interest rate swaps and was partially offset by lower cost of funds
driven by a decrease in other assets. Total average assets decreased $3.0 billion, or 10%, predominantly due to reduction in
the investment portfolio. Average long-term debt decreased $1.7 billion, or 14%, compared to 2011, primarily due to the
repayment of senior and subordinated debt. Average short-term borrowings increased $5.7 billion as our non-deposit funding
profile began to reflect a more normalized asset growth and balance sheet environment.
Total noninterest income was $2.0 billion during 2012, an increase of $1.7 billion, compared to 2011. The increase was
predominantly due to a $1.9 billion net gain on the sale of the Coke stock. These gains were partially offset by a $186 million
decrease in mark-to-market valuation gains on our public debt and index linked CDs carried at fair value, and an $83 million
decrease in net gains on the sale of other securities AFS.
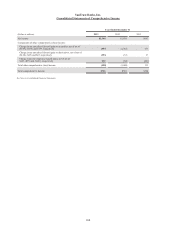
Total noninterest expenses decreased $65 million during 2012 compared to 2011. The decrease was mainly due to the potential
national mortgage servicing settlement claim expense recorded in 2011 and was partially offset by a $38 million charitable
contribution of the Coke stock to the SunTrust Foundation, higher severance expense, higher lease abandonment charges
related to office space utilization changes, and increased debt extinguishment charges during 2012 related to the redemption
of higher cost trust preferred securities. The increase in total staff expense was due to a $60 million gain related to curtailment
of our pension plan, net of a discretionary 401(k) contribution recognized during 2011 and increased incentive expenses during
2012 as a result of improved business performance.