SunTrust 2013 Annual Report Download - page 4
Download and view the complete annual report
Please find page 4 of the 2013 SunTrust annual report below. You can navigate through the pages in the report by either clicking on the pages listed below, or by using the keyword search tool below to find specific information within the annual report.-
 1
1 -
 2
2 -
 3
3 -
 4
4 -
 5
5 -
 6
6 -
 7
7 -
 8
8 -
 9
9 -
 10
10 -
 11
11 -
 12
12 -
 13
13 -
 14
14 -
 15
15 -
16
-
17
-
18
-
19
-
20
-
21
-
22
-
23
-
24
-
25
-
26
-
27
-
28
-
29
-
30
-
31
-
32
-
33
-
34
-
35
-
36
-
37
-
38
-
39
-
40
-
41
-
42
-
43
-
44
-
45
-
46
-
47
-
48
-
49
-
50
-
51
-
52
-
53
-
54
-
55
-
56
-
57
-
58
-
59
-
60
-
61
-
62
-
63
-
64
-
65
-
66
-
67
-
68
-
69
-
70
-
71
-
72
-
73
-
74
-
75
-
76
-
77
-
78
-
79
-
80
-
81
-
82
-
83
-
84
-
85
-
86
-
87
-
88
-
89
-
90
-
91
-
92
-
93
-
94
-
95
-
96
-
97
-
98
-
99
-
100
-
101
-
102
-
103
-
104
-
105
-
106
-
107
-
108
-
109
-
110
-
111
-
112
-
113
-
114
-
115
-
116
-
117
-
118
-
119
-
120
-
121
-
122
-
123
-
124
-
125
-
126
-
127
-
128
-
129
-
130
-
131
-
132
-
133
-
134
-
135
-
136
-
137
-
138
-
139
-
140
-
141
-
142
-
143
-
144
-
145
-
146
-
147
-
148
-
149
-
150
-
151
-
152
-
153
-
154
-
155
-
156
-
157
-
158
-
159
-
160
-
161
-
162
-
163
-
164
-
165
-
166
-
167
-
168
-
169
-
170
-
171
-
172
-
173
-
174
-
175
-
176
-
177
-
178
-
179
-
180
-
181
-
182
-
183
-
184
-
185
-
186
-
187
-
188
-
189
-
190
-
191
-
192
-
193
-
194
-
195
-
196
-
197
-
198
-
199
-
200
-
201
-
202
-
203
-
204
-
205
-
206
-
207
-
208
-
209
-
210
-
211
-
212
-
213
-
214
-
215
-
216
-
217
-
218
-
219
-
220
-
221
-
222
-
223
-
224
-
225
-
226
-
227
-
228
-
229
-
230
-
231
-
232
-
233
-
234
-
235
-
236
 |
 |

SunTrust Banks, Inc. 2013 Annual Report
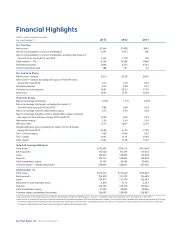
Financial Highlights
(Dollars in millions, except per share data)
Year ended December 31 2013 2012 2011
For The Year
Net income $1,344 $1,958 $647
Net income available to common shareholders 1,297 1,931 495
Net income available to common shareholders, excluding the impact of
Form 8-K items during 2013 and 2012 1 1,476 1,178 495
Total revenue — FTE 1, 2 8,194 10,598 8,600
Noninterest expense 5,880 6,323 6,234
Common dividends paid 188 107 64
Per Common Share
Net income — diluted $2.41 $3.59 $0.94
Net income — diluted, excluding the impact of Form 8-K items
during 2013 and 2012 1 2.74 2.19 0.94
Dividends declared 0.35 0.20 0.12
Common stock closing price 36.81 28.35 17.70
Book value 38.61 37.59 36.86
Financial Ratios
Return on average total assets 0.78% 1.11 % 0.38%
Return on average total assets, excluding the impact of
Form 8-K items during 2013 and 2012 1 0.88 0.68 0.38
Return on average common shareholders’ equity 6.34 9.56 2.56
Return on average tangible common shareholders’ equity, excluding
the impact of Form 8-K items during 2013 and 2012 1 10.52 8.55 3.83
Net interest margin 2 3.24 3.40 3.50
E ciency ratio 2 71.75 59.67 72.49
Tangible e ciency ratio, excluding the impact of Form 8-K items
during 2013 and 2012 1 65.86 67.34 71.99
Tier 1 common equity 9.82 10.04 9.22
Tier 1 capital 10.81 11.13 10.90
Total capital 12.81 13.48 13.67
Selected Average Balances
Total assets $172,497 $176,134 $172,440
Earning assets 153,728 153,479 147,802
Loans 122,657 122,893 116,308
Deposits 129,141 128,504 125,058
Total shareholders’ equity 21,167 20,495 20,696
Common shares — diluted (thousands) 539,093 538,061 527,618
At December 31
Total assets $175,335 $173,442 $176,859
Earning assets 156,978 151,223 154,696
Loans 127,877 121,470 122,495
Allowance for loan and lease losses 2,044 2,174 2,457
Deposits 129,759 132,316 127,922
Total shareholders’ equity 21,422 20,985 20,066
Common shares outstanding (thousands) 536,097 538,959 536,967
1 See reconciliation of non-GAAP measures in Table 36, "Reconcilement of Non-U.S. GAAP Measures - Annual," in the MD&A section of the company's 2013 Annual Report on Form 10-K.
2 Total revenue is comprised of net interest income presented on a fully taxable-equivalent (FTE) basis and noninterest income. The net interest margin and e ciency ratios are presented on an FTE basis.
The FTE basis adjusts for the tax-favored status of income from certain loans and investments. The company believes this measure is the preferred industry measurement of net interest income and
it enhances comparability of net interest income arising from taxable and tax-exempt sources.