SunTrust 2013 Annual Report Download - page 77
Download and view the complete annual report
Please find page 77 of the 2013 SunTrust annual report below. You can navigate through the pages in the report by either clicking on the pages listed below, or by using the keyword search tool below to find specific information within the annual report.-
 1
1 -
2
-
3
-
4
-
5
-
6
-
7
-
8
-
9
-
10
-
11
-
12
-
13
-
14
-
15
-
16
-
17
-
18
-
19
-
20
-
21
-
22
-
23
-
24
-
25
-
26
-
27
-
28
-
29
-
30
-
31
-
32
-
33
-
34
-
35
-
36
-
37
-
38
-
39
-
40
-
41
-
42
-
43
-
44
-
45
-
46
-
47
-
48
-
49
-
50
-
51
-
52
-
53
-
54
-
55
-
56
-
57
-
58
-
59
-
60
-
61
-
62
-
63
-
64
-
65
-
66
-
 67
67 -
 68
68 -
 69
69 -
 70
70 -
 71
71 -
 72
72 -
 73
73 -
 74
74 -
 75
75 -
 76
76 -
 77
77 -
 78
78 -
 79
79 -
 80
80 -
 81
81 -
 82
82 -
 83
83 -
 84
84 -
 85
85 -
 86
86 -
 87
87 -
88
-
89
-
90
-
91
-
92
-
93
-
94
-
95
-
96
-
97
-
98
-
99
-
100
-
101
-
102
-
103
-
104
-
105
-
106
-
107
-
108
-
109
-
110
-
111
-
112
-
113
-
114
-
115
-
116
-
117
-
118
-
119
-
120
-
121
-
122
-
123
-
124
-
125
-
126
-
127
-
128
-
129
-
130
-
131
-
132
-
133
-
134
-
135
-
136
-
137
-
138
-
139
-
140
-
141
-
142
-
143
-
144
-
145
-
146
-
147
-
148
-
149
-
150
-
151
-
152
-
153
-
154
-
155
-
156
-
157
-
158
-
159
-
160
-
161
-
162
-
163
-
164
-
165
-
166
-
167
-
168
-
169
-
170
-
171
-
172
-
173
-
174
-
175
-
176
-
177
-
178
-
179
-
180
-
181
-
182
-
183
-
184
-
185
-
186
-
187
-
188
-
189
-
190
-
191
-
192
-
193
-
194
-
195
-
196
-
197
-
198
-
199
-
200
-
201
-
202
-
203
-
204
-
205
-
206
-
207
-
208
-
209
-
210
-
211
-
212
-
213
-
214
-
215
-
216
-
217
-
218
-
219
-
220
-
221
-
222
-
223
-
224
-
225
-
226
-
227
-
228
-
229
-
230
-
231
-
232
-
233
-
234
-
235
-
236
 |
 |

61
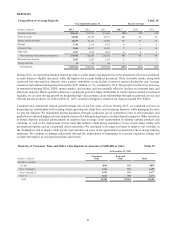
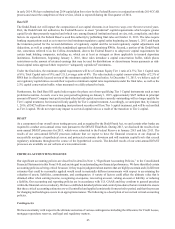
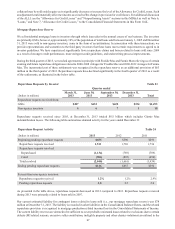
DEPOSITS
Composition of Average Deposits Table 18
Year Ended December 31 Percent of Total
(Dollars in millions) 2013 2012 2011 2013 2012 2011
Noninterest-bearing $38,643 $37,329 $31,045 30% 29% 25%
NOW accounts 26,083 25,155 24,751 20 20 20
Money market accounts 42,655 42,101 42,854 33 33 34
Savings 5,740 5,113 4,535 444
Consumer time 9,018 10,597 12,451 7810
Other time 4,937 5,954 7,036 445
Total consumer and commercial deposits 127,076 126,249 122,672 98 98 98
Brokered time deposits 2,030 2,204 2,306 222
Foreign deposits 35 51 80 ———
Total deposits $129,141 $128,504 $125,058 100% 100% 100%
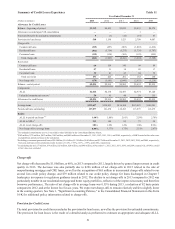
During 2013, we experienced modest deposit growth as well as improving deposit mix as the proportion of lower-cost deposit
account balances slightly increased, while the higher-cost account balances decreased. These favorable trends, along with
continued low rates paid on deposits, were a major contributor to our decline in interest expense during the year. Average
consumer and commercial deposits increased by $827 million, or 1%, compared to 2012. The growth was driven by increases
in noninterest-bearing DDA, NOW, money market, and savings, and was partially offset by declines in consumer time and
other time deposits. While a portion of the low-cost deposit growth is likely attributable to clients’ desires related to increased
liquidity, we are also driving growth by deepening high value primary client relationships through exceptional service and
relevant deposit products. As of December 31, 2013, securities pledged as collateral for deposits totaled $9.6 billion.
Consumer and commercial deposit growth remains one of our key areas of focus. During 2013, we continued to focus on
deepening our relationships with existing clients, growing our client base, and increasing deposits, while managing the rates
we pay for deposits. We maintained pricing discipline, through a judicious use of competitive rates in select products and
markets as we allowed higher rate time deposits to run-off, while growing balances in other deposit categories. Other initiatives
to attract deposits included advancements in analytics that leverage client segmentation to identify optimal products and
solutions, as well as the deployment of new tools that enhance client-facing teammates’ focus on providing clients with
personalized options and an exceptional client experience. We continued to leverage our brand to improve our visibility in
the marketplace and to inspire client loyalty and capitalize on some of the opportunities presented by the evolving banking
landscape. We continue to manage judiciously through the implications of impending or executed regulatory change and
evaluate the impacts to our deposit products and clients.
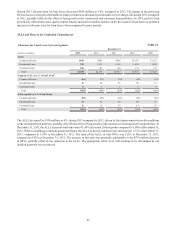
Maturity of Consumer Time and Other Time Deposits in Amounts of $100,000 or More Table 19
At December 31, 2013
(Dollars in millions)
Consumer
Time
Brokered
Time Total
Months to maturity:
3 or less $816 $43 $859
Over 3 through 6 1,121 574 1,695
Over 6 through 12 1,032 645 1,677
Over 12 1,612 762 2,374
Total $4,581 $2,024 $6,605