SunTrust 2013 Annual Report Download - page 95
Download and view the complete annual report
Please find page 95 of the 2013 SunTrust annual report below. You can navigate through the pages in the report by either clicking on the pages listed below, or by using the keyword search tool below to find specific information within the annual report.-
 1
1 -
2
-
3
-
4
-
5
-
6
-
7
-
8
-
9
-
10
-
11
-
12
-
13
-
14
-
15
-
16
-
17
-
18
-
19
-
20
-
21
-
22
-
23
-
24
-
25
-
26
-
27
-
28
-
29
-
30
-
31
-
32
-
33
-
34
-
35
-
36
-
37
-
38
-
39
-
40
-
41
-
42
-
43
-
44
-
45
-
46
-
47
-
48
-
49
-
50
-
51
-
52
-
53
-
54
-
55
-
56
-
57
-
58
-
59
-
60
-
61
-
62
-
63
-
64
-
65
-
66
-
67
-
68
-
69
-
70
-
71
-
72
-
73
-
74
-
75
-
76
-
77
-
78
-
79
-
80
-
81
-
82
-
83
-
84
-
 85
85 -
 86
86 -
 87
87 -
 88
88 -
 89
89 -
 90
90 -
 91
91 -
 92
92 -
 93
93 -
 94
94 -
 95
95 -
 96
96 -
 97
97 -
 98
98 -
 99
99 -
 100
100 -
 101
101 -
 102
102 -
 103
103 -
 104
104 -
 105
105 -
106
-
107
-
108
-
109
-
110
-
111
-
112
-
113
-
114
-
115
-
116
-
117
-
118
-
119
-
120
-
121
-
122
-
123
-
124
-
125
-
126
-
127
-
128
-
129
-
130
-
131
-
132
-
133
-
134
-
135
-
136
-
137
-
138
-
139
-
140
-
141
-
142
-
143
-
144
-
145
-
146
-
147
-
148
-
149
-
150
-
151
-
152
-
153
-
154
-
155
-
156
-
157
-
158
-
159
-
160
-
161
-
162
-
163
-
164
-
165
-
166
-
167
-
168
-
169
-
170
-
171
-
172
-
173
-
174
-
175
-
176
-
177
-
178
-
179
-
180
-
181
-
182
-
183
-
184
-
185
-
186
-
187
-
188
-
189
-
190
-
191
-
192
-
193
-
194
-
195
-
196
-
197
-
198
-
199
-
200
-
201
-
202
-
203
-
204
-
205
-
206
-
207
-
208
-
209
-
210
-
211
-
212
-
213
-
214
-
215
-
216
-
217
-
218
-
219
-
220
-
221
-
222
-
223
-
224
-
225
-
226
-
227
-
228
-
229
-
230
-
231
-
232
-
233
-
234
-
235
-
236
 |
 |

79
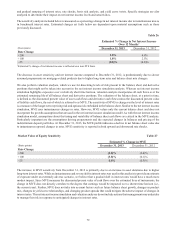
and gradual ramping of interest rates, rate shocks, basis risk analysis, and yield curve twists. Specific strategies are also
analyzed to determine their impact on net interest income levels and sensitivities.
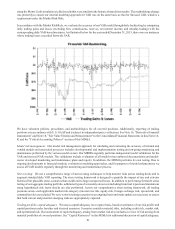
The sensitivity analysis included below is measured as a percentage change in net interest income due to instantaneous moves
in benchmark interest rates. Estimated changes set forth below are dependent upon material assumptions such as those
previously discussed.
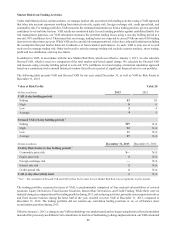
Table 26
Estimated % Change in Net Interest Income
Over 12 Months1
(Basis points) December 31, 2013 December 31, 2012
Rate Change
+200 1.8% 4.8%
+100 1.0% 2.5%
-25 (0.8)% (0.8)%
1Estimated % change of net interest income is reflected on a non-FTE basis.
The decrease in asset sensitivity and net interest income compared to December 31, 2012, is predominantly due to slower
assumed prepayments on mortgage-related products due to higher long-term rates and balance sheet mix changes.
We also perform valuation analysis, which we use for discerning levels of risk present in the balance sheet and derivative
positions that might not be taken into account in the net interest income simulation analysis. Whereas net interest income
simulation highlights exposures over a relatively short time horizon, valuation analysis incorporates all cash flows over the
estimated remaining life of all balance sheet and derivative positions. The valuation of the balance sheet, at a point in time,
is defined as the discounted present value of asset cash flows and derivative cash flows minus the discounted present value
of liability cash flows, the net of which is referred to as MVE. The sensitivity of MVE to changes in the level of interest rates
is a measure of the longer-term repricing risk and options risk embedded in the balance sheet. Similar to the net interest income
simulation, MVE uses instantaneous changes in rates. However, MVE values only the current balance sheet and does not
incorporate the growth assumptions that are used in the net interest income simulation model. As with the net interest income
simulation model, assumptions about the timing and variability of balance sheet cash flows are critical in the MVE analysis.
Particularly important are the assumptions driving prepayments and the expected changes in balances and pricing of the
indeterminate deposit portfolios. At December 31, 2013, the MVE profile indicates a decline in net balance sheet value due
to instantaneous upward changes in rates. MVE sensitivity is reported in both upward and downward rate shocks.
Market Value of Equity Sensitivity Table 27
Estimated % Change in MVE
(Basis points) December 31, 2013 December 31, 2012
Rate Change
+200 (8.0)% (2.4)%
+100 (3.8)% (0.1)%
-25 0.8% (0.3)%
The increase in MVE sensitivity from December 31, 2012 is primarily due to an increase in asset durations due to higher
long-term interest rates. While an instantaneous and severe shift in interest rates was used in this analysis to provide an estimate
of exposure under an extremely adverse scenario, we believe that a gradual shift in interest rates would have a much more
modest impact. Since MVE measures the discounted present value of cash flows over the estimated lives of instruments, the
change in MVE does not directly correlate to the degree that earnings would be impacted over a shorter time horizon (i.e.,
the current year). Further, MVE does not take into account factors such as future balance sheet growth, changes in product
mix, changes in yield curve relationships, and changing product spreads that could mitigate the adverse impact of changes in
interest rates. The net interest income simulation and valuation analyses do not include actions that management may undertake
to manage this risk in response to anticipated changes in interest rates.