SunTrust 2013 Annual Report Download - page 67
Download and view the complete annual report
Please find page 67 of the 2013 SunTrust annual report below. You can navigate through the pages in the report by either clicking on the pages listed below, or by using the keyword search tool below to find specific information within the annual report.-
 1
1 -
2
-
3
-
4
-
5
-
6
-
7
-
8
-
9
-
10
-
11
-
12
-
13
-
14
-
15
-
16
-
17
-
18
-
19
-
20
-
21
-
22
-
23
-
24
-
25
-
26
-
27
-
28
-
29
-
30
-
31
-
32
-
33
-
34
-
35
-
36
-
37
-
38
-
39
-
40
-
41
-
42
-
43
-
44
-
45
-
46
-
47
-
48
-
49
-
50
-
51
-
52
-
53
-
54
-
55
-
56
-
 57
57 -
 58
58 -
 59
59 -
 60
60 -
 61
61 -
 62
62 -
 63
63 -
 64
64 -
 65
65 -
 66
66 -
 67
67 -
 68
68 -
 69
69 -
 70
70 -
 71
71 -
 72
72 -
 73
73 -
 74
74 -
 75
75 -
 76
76 -
 77
77 -
78
-
79
-
80
-
81
-
82
-
83
-
84
-
85
-
86
-
87
-
88
-
89
-
90
-
91
-
92
-
93
-
94
-
95
-
96
-
97
-
98
-
99
-
100
-
101
-
102
-
103
-
104
-
105
-
106
-
107
-
108
-
109
-
110
-
111
-
112
-
113
-
114
-
115
-
116
-
117
-
118
-
119
-
120
-
121
-
122
-
123
-
124
-
125
-
126
-
127
-
128
-
129
-
130
-
131
-
132
-
133
-
134
-
135
-
136
-
137
-
138
-
139
-
140
-
141
-
142
-
143
-
144
-
145
-
146
-
147
-
148
-
149
-
150
-
151
-
152
-
153
-
154
-
155
-
156
-
157
-
158
-
159
-
160
-
161
-
162
-
163
-
164
-
165
-
166
-
167
-
168
-
169
-
170
-
171
-
172
-
173
-
174
-
175
-
176
-
177
-
178
-
179
-
180
-
181
-
182
-
183
-
184
-
185
-
186
-
187
-
188
-
189
-
190
-
191
-
192
-
193
-
194
-
195
-
196
-
197
-
198
-
199
-
200
-
201
-
202
-
203
-
204
-
205
-
206
-
207
-
208
-
209
-
210
-
211
-
212
-
213
-
214
-
215
-
216
-
217
-
218
-
219
-
220
-
221
-
222
-
223
-
224
-
225
-
226
-
227
-
228
-
229
-
230
-
231
-
232
-
233
-
234
-
235
-
236
 |
 |

51
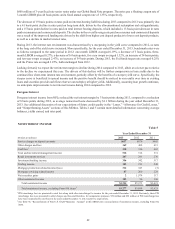
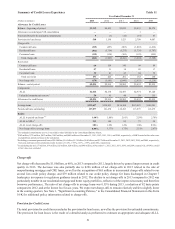
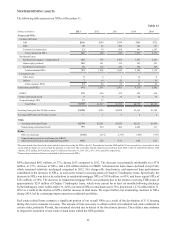
Summary of Credit Losses Experience Table 11
Year Ended December 31
(Dollars in millions) 2013 2012 2011 2010 2009
Allowance for Credit Losses
Balance - beginning of period $2,219 $2,505 $3,032 $3,235 $2,379
Allowance recorded upon VIE consolidation ——— 1—
Provision/(benefit) for unfunded commitments 5(3) (10) (57) 87
Provision for loan losses: 548 1,398 1,523 2,708 4,007
Charge-offs:
Commercial loans (219) (457) (803) (1,087) (1,432)
Residential loans (531) (1,316) (1,275) (1,736) (1,707)
Consumer loans (119) (134) (163) (195) (259)
Total charge-offs (869) (1,907) (2,241) (3,018) (3,398)
Recoveries:
Commercial loans 66 154 140 99 84
Residential loans 87 31 18 20 17
Consumer loans 38 41 43 44 59
Total recoveries 191 226 201 163 160
Net charge-offs (678) (1,681) (2,040) (2,855) (3,238)
Balance - end of period $2,094 $2,219 $2,505 $3,032 $3,235
Components:
ALLL $2,044 $2,174 $2,457 $2,974 $3,120
Unfunded commitments reserve 150 45 48 58 115
Allowance for credit losses $2,094 $2,219 $2,505 $3,032 $3,235
Average loans $122,657 $122,893 $116,308 $113,925 $121,041
Period-end loans outstanding 127,877 121,470 122,495 115,975 113,675
Ratios:
ALLL to period-end loans 2,3 1.60% 1.80% 2.01% 2.58% 2.76%
ALLL to NPLs 4212 142 85 73 59
ALLL to net charge-offs 3.01x 1.29x 1.20x 1.04x 0.96x
Net charge-offs to average loans 0.55% 1.37% 1.75% 2.51% 2.67%
1 The unfunded commitments reserve is recorded in other liabilities in the Consolidated Balance Sheets.
2 $302 million, $379 million, $433 million, $492 million, and $449 million at December 31, 2013, 2012, 2011, 2010, and 2009, respectively, of LHFI carried at fair value were
excluded from period-end loans in the calculation.
3 Excluding government-guaranteed loans of $9.0 billion, $9.6 billion, $13.9 billion, $8.8 billion, and $3.7 billion at December 31, 2013, 2012, 2011, 2010, and 2009, respectively,
from year-end loans in the calculation results in ratios of 1.72%, 1.95%, 2.27%, 2.79%, and 2.84%, respectively.
4 In calculating the ratio, $7 million, $19 million, $25 million, $28 million, and $46 million, at December 31, 2013, 2012, 2011, 2010, and 2009, respectively, of NPLs carried
at fair value were excluded.
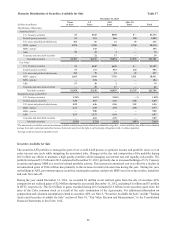
Charge-offs
Net charge-offs decreased by $1.0 billion, or 60%, in 2013 compared to 2012, largely driven by general improvement in credit
quality in 2013. The decrease was also partially due to $226 million of net charge-offs in 2012 related to the sale of
nonperforming mortgage and CRE loans, as well as the recognition of $65 million in incremental charge-offs related to our
second lien credit policy change, and $79 million related to our credit policy change for loans discharged in Chapter 7
bankruptcy in response to regulatory guidance issued in 2012. The decline in net charge-offs in 2013 compared to 2012 was
particularly notable in our residential mortgage and home equity portfolios, reflective of the improved economy and therefore
borrower performance. The ratio of net charge-offs to average loans was 0.55% during 2013, a reduction of 82 basis points
compared to 2012, and at the lowest level in six years. We expect net charge-offs to remain relatively stable to slightly lower
in the coming quarters. See Note 1, "Significant Accounting Policies," to the Consolidated Financial Statements in this Form
10-K for additional policy information related to charge-offs.
Provision for Credit Losses
The total provision for credit losses includes the provision for loan losses, as well as the provision for unfunded commitments.
The provision for loan losses is the result of a detailed analysis performed to estimate an appropriate and adequate ALLL.