SunTrust 2013 Annual Report Download - page 209
Download and view the complete annual report
Please find page 209 of the 2013 SunTrust annual report below. You can navigate through the pages in the report by either clicking on the pages listed below, or by using the keyword search tool below to find specific information within the annual report.-
 1
1 -
2
-
3
-
4
-
5
-
6
-
7
-
8
-
9
-
10
-
11
-
12
-
13
-
14
-
15
-
16
-
17
-
18
-
19
-
20
-
21
-
22
-
23
-
24
-
25
-
26
-
27
-
28
-
29
-
30
-
31
-
32
-
33
-
34
-
35
-
36
-
37
-
38
-
39
-
40
-
41
-
42
-
43
-
44
-
45
-
46
-
47
-
48
-
49
-
50
-
51
-
52
-
53
-
54
-
55
-
56
-
57
-
58
-
59
-
60
-
61
-
62
-
63
-
64
-
65
-
66
-
67
-
68
-
69
-
70
-
71
-
72
-
73
-
74
-
75
-
76
-
77
-
78
-
79
-
80
-
81
-
82
-
83
-
84
-
85
-
86
-
87
-
88
-
89
-
90
-
91
-
92
-
93
-
94
-
95
-
96
-
97
-
98
-
99
-
100
-
101
-
102
-
103
-
104
-
105
-
106
-
107
-
108
-
109
-
110
-
111
-
112
-
113
-
114
-
115
-
116
-
117
-
118
-
119
-
120
-
121
-
122
-
123
-
124
-
125
-
126
-
127
-
128
-
129
-
130
-
131
-
132
-
133
-
134
-
135
-
136
-
137
-
138
-
139
-
140
-
141
-
142
-
143
-
144
-
145
-
146
-
147
-
148
-
149
-
150
-
151
-
152
-
153
-
154
-
155
-
156
-
157
-
158
-
159
-
160
-
161
-
162
-
163
-
164
-
165
-
166
-
167
-
168
-
169
-
170
-
171
-
172
-
173
-
174
-
175
-
176
-
177
-
178
-
179
-
180
-
181
-
182
-
183
-
184
-
185
-
186
-
187
-
188
-
189
-
190
-
191
-
192
-
193
-
194
-
195
-
196
-
197
-
198
-
 199
199 -
 200
200 -
 201
201 -
 202
202 -
 203
203 -
 204
204 -
 205
205 -
 206
206 -
 207
207 -
 208
208 -
 209
209 -
 210
210 -
 211
211 -
 212
212 -
 213
213 -
 214
214 -
 215
215 -
 216
216 -
 217
217 -
 218
218 -
 219
219 -
220
-
221
-
222
-
223
-
224
-
225
-
226
-
227
-
228
-
229
-
230
-
231
-
232
-
233
-
234
-
235
-
236
 |
 |
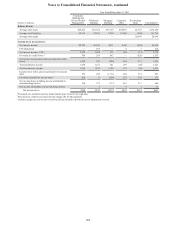
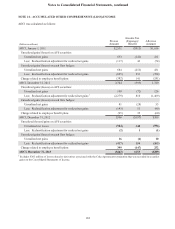
Notes to Consolidated Financial Statements, continued
193
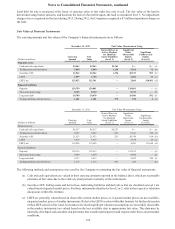
(d) LHFI fair values are based on a hypothetical exit price, which does not represent the estimated intrinsic value of the
loan if held for investment. The assumptions used are expected to approximate those that a market participant
purchasing the loans would use to value the loans, including a market risk premium and liquidity discount. Estimating
the fair value of the loan portfolio when loan sales and trading markets are illiquid, or for certain loan types, nonexistent,
requires significant judgment. Therefore, the estimated fair value can vary significantly depending on a market
participant’s ultimate considerations and assumptions. The final value yields a market participant’s expected return
on investment that is indicative of the current market conditions, but it does not take into consideration the Company’s
estimated value from continuing to hold these loans or its lack of willingness to transact at these estimated values.
The Company generally estimated fair value for LHFI based on estimated future cash flows discounted, initially, at
current origination rates for loans with similar terms and credit quality, which derived an estimated value of 99%
and 101% on the loan portfolio’s net carrying value at December 31, 2013 and 2012, respectively. The value derived
from origination rates likely does not represent an exit price; therefore, an incremental market risk and liquidity
discount was subtracted from the initial value at December 31, 2013 and 2012. The discounted value is a function
of a market participant’s required yield in the current environment and is not a reflection of the expected cumulative
losses on the loans. Loan prepayments are used to adjust future cash flows based on historical experience and
prepayment model forecasts. The value of related accrued interest on loans approximates fair value; however, it is
not included in the carrying amount or fair value of loans. The value of long-term customer relationships is not
permitted under current U.S. GAAP to be included in the estimated fair value.
(e) Deposit liabilities with no defined maturity such as DDAs, NOW/money market accounts, and savings accounts have
a fair value equal to the amount payable on demand at the reporting date (i.e., their carrying amounts). Fair values
for CDs are estimated using a discounted cash flow measurement that applies current interest rates to a schedule of
aggregated expected maturities. The assumptions used in the discounted cash flow analysis are expected to
approximate those that market participants would use in valuing deposits. The value of long-term relationships with
depositors is not taken into account in estimating fair values. For valuation of brokered time deposits that the Company
carries at fair value as well as those that are carried at amortized cost, refer to the respective valuation section within
this footnote.
(f) Fair values for short-term borrowings and certain long-term debt are based on quoted market prices for similar
instruments or estimated using discounted cash flow analysis and the Company’s current incremental borrowing rates
for similar types of instruments. For long-term debt that the Company carries at fair value, refer to the respective
valuation section within this footnote. For level 3 debt, the terms are unique in nature or there are otherwise no similar
instruments that can be used to value the instrument without using significant unobservable assumptions. In this
situation, we look at current borrowing rates along with the collateral levels that secure the debt in determining an
appropriate fair value adjustment.
Unfunded loan commitments and letters of credit are not included in the table above. At December 31, 2013 and 2012, the
Company had $48.9 billion and $42.7 billion, respectively, of unfunded commercial loan commitments and letters of credit.
A reasonable estimate of the fair value of these instruments is the carrying value of deferred fees plus the related unfunded
commitments reserve, which was a combined $53 million and $49 million at December 31, 2013 and 2012, respectively. No
active trading market exists for these instruments, and the estimated fair value does not include any value associated with the
borrower relationship. The Company does not estimate the fair values of consumer unfunded lending commitments which
can generally be canceled by providing notice to the borrower.
NOTE 19 – CONTINGENCIES
Litigation and Regulatory Matters
In the ordinary course of business, the Company and its subsidiaries are parties to numerous civil claims and lawsuits and
subject to regulatory examinations, investigations, and requests for information. Some of these matters involve claims for
substantial amounts. The Company’s experience has shown that the damages alleged by plaintiffs or claimants are often
overstated, based on novel or unsubstantiated legal theories, unsupported by facts, and/or bear no relation to the ultimate
award that a court might grant. Additionally, the outcome of litigation and regulatory matters and the timing of ultimate
resolution are inherently difficult to predict. Because of these factors, the Company typically cannot provide a meaningful
estimate of the range of reasonably possible outcomes of claims in the aggregate or by individual claim. However, on a case-
by-case basis, reserves are established for those legal claims in which it is probable that a loss will be incurred and the amount
of such loss can be reasonably estimated. The actual costs of resolving these claims may be substantially higher or lower than
the amounts reserved.