SunTrust 2013 Annual Report Download - page 60
Download and view the complete annual report
Please find page 60 of the 2013 SunTrust annual report below. You can navigate through the pages in the report by either clicking on the pages listed below, or by using the keyword search tool below to find specific information within the annual report.-
 1
1 -
2
-
3
-
4
-
5
-
6
-
7
-
8
-
9
-
10
-
11
-
12
-
13
-
14
-
15
-
16
-
17
-
18
-
19
-
20
-
21
-
22
-
23
-
24
-
25
-
26
-
27
-
28
-
29
-
30
-
31
-
32
-
33
-
34
-
35
-
36
-
37
-
38
-
39
-
40
-
41
-
42
-
43
-
44
-
45
-
46
-
47
-
48
-
49
-
 50
50 -
 51
51 -
 52
52 -
 53
53 -
 54
54 -
 55
55 -
 56
56 -
 57
57 -
 58
58 -
 59
59 -
 60
60 -
 61
61 -
 62
62 -
 63
63 -
 64
64 -
 65
65 -
 66
66 -
 67
67 -
 68
68 -
 69
69 -
 70
70 -
71
-
72
-
73
-
74
-
75
-
76
-
77
-
78
-
79
-
80
-
81
-
82
-
83
-
84
-
85
-
86
-
87
-
88
-
89
-
90
-
91
-
92
-
93
-
94
-
95
-
96
-
97
-
98
-
99
-
100
-
101
-
102
-
103
-
104
-
105
-
106
-
107
-
108
-
109
-
110
-
111
-
112
-
113
-
114
-
115
-
116
-
117
-
118
-
119
-
120
-
121
-
122
-
123
-
124
-
125
-
126
-
127
-
128
-
129
-
130
-
131
-
132
-
133
-
134
-
135
-
136
-
137
-
138
-
139
-
140
-
141
-
142
-
143
-
144
-
145
-
146
-
147
-
148
-
149
-
150
-
151
-
152
-
153
-
154
-
155
-
156
-
157
-
158
-
159
-
160
-
161
-
162
-
163
-
164
-
165
-
166
-
167
-
168
-
169
-
170
-
171
-
172
-
173
-
174
-
175
-
176
-
177
-
178
-
179
-
180
-
181
-
182
-
183
-
184
-
185
-
186
-
187
-
188
-
189
-
190
-
191
-
192
-
193
-
194
-
195
-
196
-
197
-
198
-
199
-
200
-
201
-
202
-
203
-
204
-
205
-
206
-
207
-
208
-
209
-
210
-
211
-
212
-
213
-
214
-
215
-
216
-
217
-
218
-
219
-
220
-
221
-
222
-
223
-
224
-
225
-
226
-
227
-
228
-
229
-
230
-
231
-
232
-
233
-
234
-
235
-
236
 |
 |

44
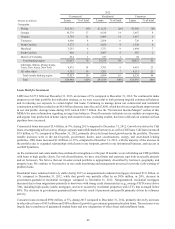
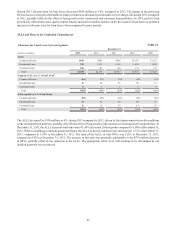
compared to $144.9 billion at December 31, 2012. The decline was driven by the sales of servicing on certain loans in the
servicing portfolio.
Net securities gains decreased $2.0 billion during 2013 compared to 2012 due to the early termination during 2012 of agreements
regarding our previously owned shares of Coke common stock, resulting in a $1.9 billion gain on disposition of the stock in
2012. For further discussion regarding our investment portfolio activity and the Coke transaction, see the “Securities Available
for Sale” section in this MD&A.
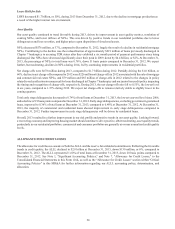
Other noninterest income increased $56 million, or 58%, during 2013 compared to 2012. The increase was primarily due to
a $92 million loss recognized in 2012 upon the transfer to LHFS of guaranteed student and mortgage loans to be sold and the
sale during 2013 of held for sale affordable housing properties resulting in a gain on sale of $17 million. This was partially
offset by $50 million in lease financing asset impairments in 2013 as a result of updated market indicators of the residual
values of the assets. For additional information on the lease financing impairment, see Note 18, "Fair Value Election and
Measurement," to the Consolidated Financial Statements in this Form 10-K.
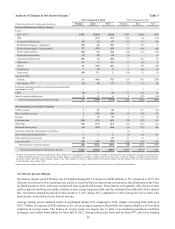
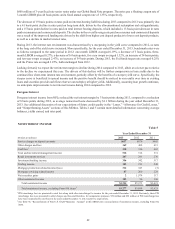
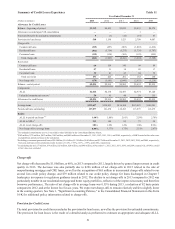
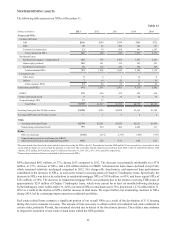
NONINTEREST EXPENSE
Table 6
Year Ended December 31
(Dollars in millions) 2013 2012 2011
Employee compensation $2,488 $2,603 $2,494
Employee benefits 413 474 382
Personnel expenses 2,901 3,077 2,876
Outside processing and software 746 710 653
Net occupancy expense 348 359 356
Operating losses 503 277 377
Credit and collection services 264 239 275
Regulatory assessments 181 233 300
Equipment expense 181 188 178
Marketing and customer development 135 184 184
Consulting and legal fees 73 165 120
Postage and delivery 69 76 81
Other staff expense 66 94 95
Communications 63 63 63
Operating supplies 28 34 45
Amortization/impairment of intangible assets/goodwill 23 46 43
Other real estate expense 4140 264
Impairment of affordable housing investments 396 10
Net loss/(gain) on debt extinguishment —16 (3)
Other expense 292 326 317
Total noninterest expense $5,880 $6,323 $6,234
Total noninterest expense, excluding Form 8-K items 1$5,461 $6,189 $6,234
1 See Table 36, "Reconcilement of Non-U.S. GAAP Measures - Annual," in this MD&A for a reconciliation of noninterest expense, excluding Form 8-K
items.
Noninterest expense decreased $443 million, or 7%, during 2013 compared to 2012, driven by declines across most expense
categories including personnel expenses, legal and consulting expenses, and certain cyclically high credit-related costs (driven
by other real estate expense), partially offset by higher operating losses. Excluding the impact of Form 8-K items in 2013 and
2012, noninterest expense decreased 12% due to improved expense management and the abatement of certain cyclically high
credit-related costs. See Table 36, "Reconcilement of Non-U.S. GAAP Measures - Annual," in this MD&A for a reconciliation
of noninterest expense, excluding Form 8-K items
Personnel expenses decreased $176 million, or 6%, compared to 2012. The decrease was largely attributable to lower salary
and other benefits costs during the year, partially driven by the decline in full time equivalent employees from 2012. Full time
equivalent employees declined by 2% compared to 2012, as a result of efficiency improvements, particularly in our branch
staffing model as we reduced our number of branches by 7% compared to December 31, 2012, to better align our distribution
channels with evolving client preferences. Additional branch reductions will occur in 2014, but the rate of decline will be less