SunTrust 2013 Annual Report Download - page 65
Download and view the complete annual report
Please find page 65 of the 2013 SunTrust annual report below. You can navigate through the pages in the report by either clicking on the pages listed below, or by using the keyword search tool below to find specific information within the annual report.-
 1
1 -
2
-
3
-
4
-
5
-
6
-
7
-
8
-
9
-
10
-
11
-
12
-
13
-
14
-
15
-
16
-
17
-
18
-
19
-
20
-
21
-
22
-
23
-
24
-
25
-
26
-
27
-
28
-
29
-
30
-
31
-
32
-
33
-
34
-
35
-
36
-
37
-
38
-
39
-
40
-
41
-
42
-
43
-
44
-
45
-
46
-
47
-
48
-
49
-
50
-
51
-
52
-
53
-
54
-
 55
55 -
 56
56 -
 57
57 -
 58
58 -
 59
59 -
 60
60 -
 61
61 -
 62
62 -
 63
63 -
 64
64 -
 65
65 -
 66
66 -
 67
67 -
 68
68 -
 69
69 -
 70
70 -
 71
71 -
 72
72 -
 73
73 -
 74
74 -
 75
75 -
76
-
77
-
78
-
79
-
80
-
81
-
82
-
83
-
84
-
85
-
86
-
87
-
88
-
89
-
90
-
91
-
92
-
93
-
94
-
95
-
96
-
97
-
98
-
99
-
100
-
101
-
102
-
103
-
104
-
105
-
106
-
107
-
108
-
109
-
110
-
111
-
112
-
113
-
114
-
115
-
116
-
117
-
118
-
119
-
120
-
121
-
122
-
123
-
124
-
125
-
126
-
127
-
128
-
129
-
130
-
131
-
132
-
133
-
134
-
135
-
136
-
137
-
138
-
139
-
140
-
141
-
142
-
143
-
144
-
145
-
146
-
147
-
148
-
149
-
150
-
151
-
152
-
153
-
154
-
155
-
156
-
157
-
158
-
159
-
160
-
161
-
162
-
163
-
164
-
165
-
166
-
167
-
168
-
169
-
170
-
171
-
172
-
173
-
174
-
175
-
176
-
177
-
178
-
179
-
180
-
181
-
182
-
183
-
184
-
185
-
186
-
187
-
188
-
189
-
190
-
191
-
192
-
193
-
194
-
195
-
196
-
197
-
198
-
199
-
200
-
201
-
202
-
203
-
204
-
205
-
206
-
207
-
208
-
209
-
210
-
211
-
212
-
213
-
214
-
215
-
216
-
217
-
218
-
219
-
220
-
221
-
222
-
223
-
224
-
225
-
226
-
227
-
228
-
229
-
230
-
231
-
232
-
233
-
234
-
235
-
236
 |
 |

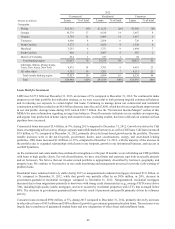
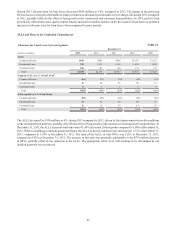
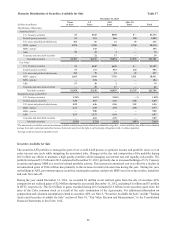
49
2012
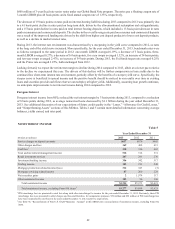
Commercial Residential Consumer
(Dollars in millions) Loans % of total Loans % of total Loans % of total
Geography:
Florida $11,361 19% $11,123 26% $3,586 18%
Georgia 10,178 17 6,188 14 1,467 8
Virginia 6,758 12 6,089 14 1,667 9
Tennessee 4,696 8 2,504 6 720 4
North Carolina 3,275 6 3,826 9 1,528 8
Maryland 3,293 6 3,751 9 1,404 7
South Carolina 866 1 2,097 5 387 2
District of Columbia 634 1 637 1 94 —
Total banking region 41,061 70 36,215 84 10,853 56
California, Illinois, Pennsylvania,
Texas, New Jersey, New York 8,475 14 3,783 9 4,419 23
All other states 9,352 16 3,201 7 4,111 21
Total outside banking region 17,827 30 6,984 16 8,530 44
Total $58,888 100% $43,199 100% $19,383 100%
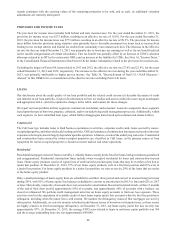
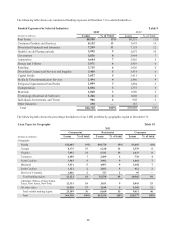
Loans Held for Investment
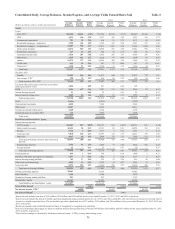
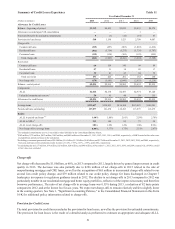
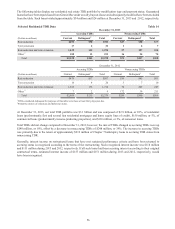
LHFI were $127.9 billion at December 31, 2013, an increase of 5% compared to December 31, 2012. We continued to make
progress in our loan portfolio diversification strategy, as we were successful in both growing targeted commercial balances
and in reducing our exposure to certain higher risk loans. Continuing to manage down our commercial and residential
construction portfolios resulted in an $8.6 billion decrease since the end of 2008, which has driven a significant improvement
in our risk profile. Average loans during 2013 totaled $122.7 billion. See the "Net Interest Income/Margin" section of this
MD&A for more information regarding average loan balances. Overall economic indicators in our markets are improving,
and organic loan production in home equity and consumer loans, excluding student, has been solid and our commercial loan
pipelines have increased.
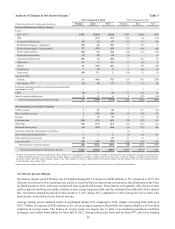
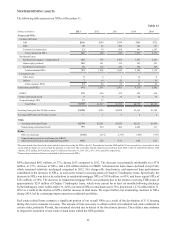
Commercial loans increased $5.4 billion, or 9%, during 2013 compared to December 31, 2012. Growth was driven by C&I
loans, encompassing a diverse array of large corporate and middle market borrowers, as well as CRE loans. C&I loans increased
$3.9 billion, or 7%, compared to December 31, 2012, primarily driven by broad-based growth across the portfolio. The most
notable increases were in the not-for-profit, government, dealer, asset securitizations, energy, and asset-based lending
portfolios. CRE loans increased $1.4 billion, or 33%, compared to December 31, 2012, with the majority of the increase in
the portfolio due to expanded relationships with clients in our footprint, growth in our institutional business, and success in
our REIT platform.
As the commercial real estate market has continued to strengthen over the past 18 months, we are rebuilding our CRE portfolio
with loans to high quality clients. For risk diversification, we have strict limits and exposure caps both on specific projects
and on borrowers. We believe that our investor-owned portfolio is appropriately diversified by borrower, geography, and
property type. We continue to be proactive in our credit monitoring and management processes to provide early warning of
problem loans.
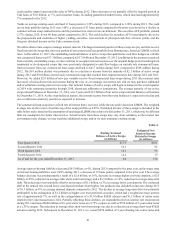
Residential loans remained relatively stable during 2013 as nonguaranteed residential mortgages increased $1.0 billion, or
4%, compared to December 31, 2012, while that growth was partially offset by an $836 million, or 20%, decrease in
government-guaranteed residential mortgages compared to December 31, 2012. Nonguaranteed residential mortgages
increased due to loan originations primarily to borrowers with strong credit characteristics (e.g., average FICO scores above
760), including high quality jumbo mortgages, and were secured by residential properties with LTVs that averaged below
80%. The decrease in government-guaranteed loans was the result of payments and payoffs primarily driven by refinance
activity.
Consumer loans increased $994 million, or 5%, during 2013 compared to December 31, 2012, primarily driven by increases
in other direct loans of $433 million and $188 million of growth in government-guaranteed student loans. The increases were
largely due to purchases of guaranteed student loans and new originations of other direct and installment loans.