SunTrust 2013 Annual Report Download - page 137
Download and view the complete annual report
Please find page 137 of the 2013 SunTrust annual report below. You can navigate through the pages in the report by either clicking on the pages listed below, or by using the keyword search tool below to find specific information within the annual report.-
 1
1 -
2
-
3
-
4
-
5
-
6
-
7
-
8
-
9
-
10
-
11
-
12
-
13
-
14
-
15
-
16
-
17
-
18
-
19
-
20
-
21
-
22
-
23
-
24
-
25
-
26
-
27
-
28
-
29
-
30
-
31
-
32
-
33
-
34
-
35
-
36
-
37
-
38
-
39
-
40
-
41
-
42
-
43
-
44
-
45
-
46
-
47
-
48
-
49
-
50
-
51
-
52
-
53
-
54
-
55
-
56
-
57
-
58
-
59
-
60
-
61
-
62
-
63
-
64
-
65
-
66
-
67
-
68
-
69
-
70
-
71
-
72
-
73
-
74
-
75
-
76
-
77
-
78
-
79
-
80
-
81
-
82
-
83
-
84
-
85
-
86
-
87
-
88
-
89
-
90
-
91
-
92
-
93
-
94
-
95
-
96
-
97
-
98
-
99
-
100
-
101
-
102
-
103
-
104
-
105
-
106
-
107
-
108
-
109
-
110
-
111
-
112
-
113
-
114
-
115
-
116
-
117
-
118
-
119
-
120
-
121
-
122
-
123
-
124
-
125
-
126
-
 127
127 -
 128
128 -
 129
129 -
 130
130 -
 131
131 -
 132
132 -
 133
133 -
 134
134 -
 135
135 -
 136
136 -
 137
137 -
 138
138 -
 139
139 -
 140
140 -
 141
141 -
 142
142 -
 143
143 -
 144
144 -
 145
145 -
 146
146 -
 147
147 -
148
-
149
-
150
-
151
-
152
-
153
-
154
-
155
-
156
-
157
-
158
-
159
-
160
-
161
-
162
-
163
-
164
-
165
-
166
-
167
-
168
-
169
-
170
-
171
-
172
-
173
-
174
-
175
-
176
-
177
-
178
-
179
-
180
-
181
-
182
-
183
-
184
-
185
-
186
-
187
-
188
-
189
-
190
-
191
-
192
-
193
-
194
-
195
-
196
-
197
-
198
-
199
-
200
-
201
-
202
-
203
-
204
-
205
-
206
-
207
-
208
-
209
-
210
-
211
-
212
-
213
-
214
-
215
-
216
-
217
-
218
-
219
-
220
-
221
-
222
-
223
-
224
-
225
-
226
-
227
-
228
-
229
-
230
-
231
-
232
-
233
-
234
-
235
-
236
 |
 |
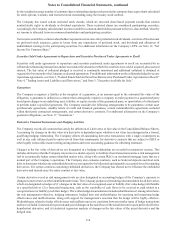
Notes to Consolidated Financial Statements, continued
121
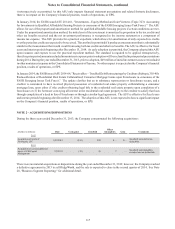
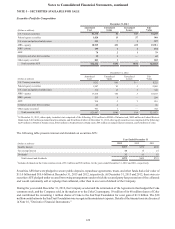
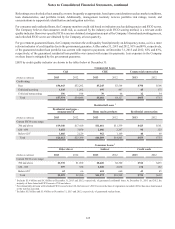
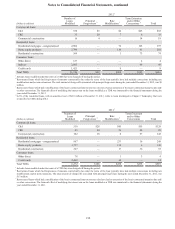
The amortized cost and fair value of investments in debt securities at December 31, 2013, by estimated average life, are shown
below. Actual cash flows may differ from estimated average lives and contractual maturities because borrowers may have the
right to call or prepay obligations with or without penalties.
Distribution of Maturities
(Dollars in millions)
1 Year
or Less
1-5
Years
5-10
Years
After 10
Years Total
Amortized Cost:
U.S. Treasury securities $1 $645 $688 $— $1,334
Federal agency securities 51 261 566 150 1,028
U.S. states and political subdivisions 102 66 21 43 232
MBS - agency 1,575 5,780 7,800 3,760 18,915
MBS - private — 155 — — 155
ABS 58 18 2 — 78
Corporate and other debt securities —2217—39
Total debt securities $1,787 $6,947 $9,094 $3,953 $21,781
Fair Value:
U.S. Treasury securities $1 $647 $645 $— $1,293
Federal agency securities 51 271 518 144 984
U.S. states and political subdivisions 104 70 21 42 237
MBS - agency 1,665 5,969 7,756 3,521 18,911
MBS - private — 154 — — 154
ABS 57 20 2 — 79
Corporate and other debt securities —2517—42
Total debt securities $1,878 $7,156 $8,959 $3,707 $21,700
Weighted average yield12.95% 2.72% 2.83% 2.85% 2.81%
1Average yields are based on amortized cost and presented on a FTE basis.
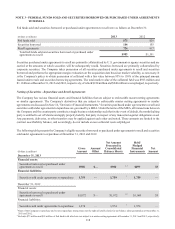
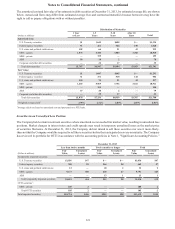
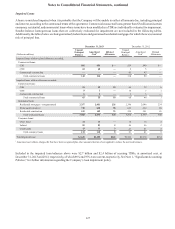
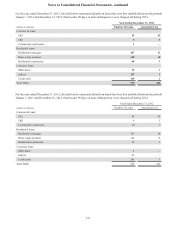
Securities in an Unrealized Loss Position
The Company held certain investment securities where amortized cost exceeded fair market value, resulting in unrealized loss
positions. Market changes in interest rates and credit spreads may result in temporary unrealized losses as the market price
of securities fluctuates. At December 31, 2013, the Company did not intend to sell these securities nor was it more-likely-
than-not that the Company would be required to sell these securities before their anticipated recovery or maturity. The Company
has reviewed its portfolio for OTTI in accordance with the accounting policies in Note 1, "Significant Accounting Policies."
December 31, 2013
Less than twelve months Twelve months or longer Total
(Dollars in millions)
Fair
Value
Unrealized
Losses
Fair
Value
Unrealized
Losses
Fair
Value
Unrealized
Losses
Temporarily impaired securities:
U.S. Treasury securities $1,036 $47 $— $— $1,036 $47
Federal agency securities 398 29 264 28 662 57
U.S. states and political subdivisions 12 — 20 2 32 2
MBS - agency 9,173 358 618 67 9,791 425
ABS ——13 1131
Total temporarily impaired securities 10,619 434 915 98 11,534 532
OTTI securities1:
MBS - private 105 2 — — 105 2
Total OTTI securities 105 2 — — 105 2
Total impaired securities $10,724 $436 $915 $98 $11,639 $534