SunTrust 2013 Annual Report Download - page 217
Download and view the complete annual report
Please find page 217 of the 2013 SunTrust annual report below. You can navigate through the pages in the report by either clicking on the pages listed below, or by using the keyword search tool below to find specific information within the annual report.-
 1
1 -
2
-
3
-
4
-
5
-
6
-
7
-
8
-
9
-
10
-
11
-
12
-
13
-
14
-
15
-
16
-
17
-
18
-
19
-
20
-
21
-
22
-
23
-
24
-
25
-
26
-
27
-
28
-
29
-
30
-
31
-
32
-
33
-
34
-
35
-
36
-
37
-
38
-
39
-
40
-
41
-
42
-
43
-
44
-
45
-
46
-
47
-
48
-
49
-
50
-
51
-
52
-
53
-
54
-
55
-
56
-
57
-
58
-
59
-
60
-
61
-
62
-
63
-
64
-
65
-
66
-
67
-
68
-
69
-
70
-
71
-
72
-
73
-
74
-
75
-
76
-
77
-
78
-
79
-
80
-
81
-
82
-
83
-
84
-
85
-
86
-
87
-
88
-
89
-
90
-
91
-
92
-
93
-
94
-
95
-
96
-
97
-
98
-
99
-
100
-
101
-
102
-
103
-
104
-
105
-
106
-
107
-
108
-
109
-
110
-
111
-
112
-
113
-
114
-
115
-
116
-
117
-
118
-
119
-
120
-
121
-
122
-
123
-
124
-
125
-
126
-
127
-
128
-
129
-
130
-
131
-
132
-
133
-
134
-
135
-
136
-
137
-
138
-
139
-
140
-
141
-
142
-
143
-
144
-
145
-
146
-
147
-
148
-
149
-
150
-
151
-
152
-
153
-
154
-
155
-
156
-
157
-
158
-
159
-
160
-
161
-
162
-
163
-
164
-
165
-
166
-
167
-
168
-
169
-
170
-
171
-
172
-
173
-
174
-
175
-
176
-
177
-
178
-
179
-
180
-
181
-
182
-
183
-
184
-
185
-
186
-
187
-
188
-
189
-
190
-
191
-
192
-
193
-
194
-
195
-
196
-
197
-
198
-
199
-
200
-
201
-
202
-
203
-
204
-
205
-
206
-
 207
207 -
 208
208 -
 209
209 -
 210
210 -
 211
211 -
 212
212 -
 213
213 -
 214
214 -
 215
215 -
 216
216 -
 217
217 -
 218
218 -
 219
219 -
 220
220 -
 221
221 -
 222
222 -
 223
223 -
 224
224 -
 225
225 -
 226
226 -
 227
227 -
228
-
229
-
230
-
231
-
232
-
233
-
234
-
235
-
236
 |
 |

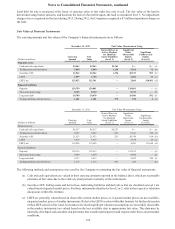
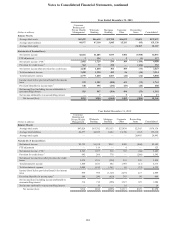
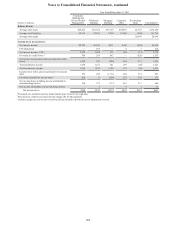
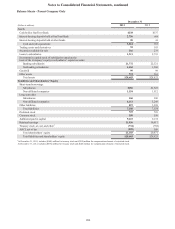
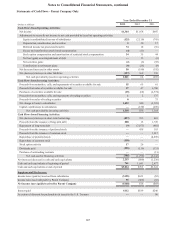
Notes to Consolidated Financial Statements, continued
201
Year Ended December 31, 2013
(Dollars in millions)
Consumer
Banking and
Private Wealth
Management
Wholesale
Banking
Mortgage
Banking
Corporate
Other
Reconciling
Items Consolidated
Balance Sheets:
Average total assets $45,487 $66,618 $32,708 $26,033 $1,651 $172,497
Average total liabilities 84,977 47,310 3,845 15,293 (95) 151,330
Average total equity — — — — 21,167 21,167
Statements of Income/(loss):
Net interest income $2,601 $1,605 $539 $306 ($198) $4,853
FTE adjustment 1 124 — 3 (1) 127
Net interest income - FTE 12,602 1,729 539 309 (199) 4,980
Provision for credit losses 2362 79 238 — (126) 553
Net interest income after provision for credit losses 2,240 1,650 301 309 (73) 4,427
Total noninterest income 1,480 1,290 402 56 (14) 3,214
Total noninterest expense 2,797 1,638 1,503 (46) (12) 5,880
Income/(loss) before provision/(benefit) for income
taxes 923 1,302 (800) 411 (75) 1,761
Provision/(benefit) for income taxes 3340 395 (232) (83) (20) 400
Net income/(loss) including income attributable to
noncontrolling interest 583 907 (568) 494 (55) 1,361
Net income attributable to noncontrolling interest —7—9 1 17
Net income/(loss) $583 $900 ($568) $485 ($56) $1,344
Year Ended December 31, 2012
(Dollars in millions)
Consumer
Banking and
Private Wealth
Management
Wholesale
Banking
Mortgage
Banking
Corporate
Other
Reconciling
Items Consolidated
Balance Sheets:
Average total assets $47,024 $63,782 $35,153 $27,830 $2,345 $176,134
Average total liabilities 84,677 46,935 4,484 19,706 (163) 155,639
Average total equity — — — — 20,495 20,495
Statements of Income/(loss):
Net interest income $2,723 $1,538 $512 $389 ($60) $5,102
FTE adjustment — 119 — 4 — 123
Net interest income - FTE 12,723 1,657 512 393 (60) 5,225
Provision for credit losses 2645 266 770 — (286) 1,395
Net interest income/(loss) after provision for credit
losses 2,078 1,391 (258) 393 226 3,830
Total noninterest income 1,500 1,413 502 1,969 (11) 5,373
Total noninterest expense 3,088 1,810 1,369 68 (12) 6,323
Income/(loss) before provision/(benefit) for income
taxes 490 994 (1,125) 2,294 227 2,880
Provision/(benefit) for income taxes 3180 280 (429) 767 98 896
Net income/(loss) including income attributable to
noncontrolling interest 310 714 (696) 1,527 129 1,984
Net income attributable to noncontrolling interest — 16 — 10 — 26
Net income/(loss) $310 $698 ($696) $1,517 $129 $1,958