SunTrust 2013 Annual Report Download - page 199
Download and view the complete annual report
Please find page 199 of the 2013 SunTrust annual report below. You can navigate through the pages in the report by either clicking on the pages listed below, or by using the keyword search tool below to find specific information within the annual report.-
 1
1 -
2
-
3
-
4
-
5
-
6
-
7
-
8
-
9
-
10
-
11
-
12
-
13
-
14
-
15
-
16
-
17
-
18
-
19
-
20
-
21
-
22
-
23
-
24
-
25
-
26
-
27
-
28
-
29
-
30
-
31
-
32
-
33
-
34
-
35
-
36
-
37
-
38
-
39
-
40
-
41
-
42
-
43
-
44
-
45
-
46
-
47
-
48
-
49
-
50
-
51
-
52
-
53
-
54
-
55
-
56
-
57
-
58
-
59
-
60
-
61
-
62
-
63
-
64
-
65
-
66
-
67
-
68
-
69
-
70
-
71
-
72
-
73
-
74
-
75
-
76
-
77
-
78
-
79
-
80
-
81
-
82
-
83
-
84
-
85
-
86
-
87
-
88
-
89
-
90
-
91
-
92
-
93
-
94
-
95
-
96
-
97
-
98
-
99
-
100
-
101
-
102
-
103
-
104
-
105
-
106
-
107
-
108
-
109
-
110
-
111
-
112
-
113
-
114
-
115
-
116
-
117
-
118
-
119
-
120
-
121
-
122
-
123
-
124
-
125
-
126
-
127
-
128
-
129
-
130
-
131
-
132
-
133
-
134
-
135
-
136
-
137
-
138
-
139
-
140
-
141
-
142
-
143
-
144
-
145
-
146
-
147
-
148
-
149
-
150
-
151
-
152
-
153
-
154
-
155
-
156
-
157
-
158
-
159
-
160
-
161
-
162
-
163
-
164
-
165
-
166
-
167
-
168
-
169
-
170
-
171
-
172
-
173
-
174
-
175
-
176
-
177
-
178
-
179
-
180
-
181
-
182
-
183
-
184
-
185
-
186
-
187
-
188
-
 189
189 -
 190
190 -
 191
191 -
 192
192 -
 193
193 -
 194
194 -
 195
195 -
 196
196 -
 197
197 -
 198
198 -
 199
199 -
 200
200 -
 201
201 -
 202
202 -
 203
203 -
 204
204 -
 205
205 -
 206
206 -
 207
207 -
 208
208 -
 209
209 -
210
-
211
-
212
-
213
-
214
-
215
-
216
-
217
-
218
-
219
-
220
-
221
-
222
-
223
-
224
-
225
-
226
-
227
-
228
-
229
-
230
-
231
-
232
-
233
-
234
-
235
-
236
 |
 |
Notes to Consolidated Financial Statements, continued
183
Financial Assets and Variable Interest Entities," and Note 16, “Derivative Financial Instruments,” for further
discussion of this business), (ii) loans backed by the SBA, and (iii) the loan sales and trading business within the
Company’s Wholesale Banking segment. All of these loans are classified as level 2, due to the market data that the
Company uses in the estimate of fair value.
The loans made in connection with the Company’s TRS business are short-term, demand loans, whereby the repayment
is senior in priority and whose value is collateralized. While these loans do not trade in the market, the Company
believes that the par amount of the loans approximates fair value and no unobservable assumptions are made by the
Company to arrive at this conclusion. At December 31, 2013 and 2012, the Company had outstanding $1.5 billion
and $1.9 billion, respectively, of such short-term loans carried at fair value.
SBA loans are similar to SBA securities discussed herein under “Federal agency securities,” except for their legal
form. In both cases, the Company trades instruments that are fully guaranteed by the U.S. government as to contractual
principal and interest and there is sufficient observable trading activity upon which to base the estimate of fair value.
As these SBA loans are fully guaranteed, the changes in fair value are attributable to factors other than instrument-
specific credit risk.
The loans from the Company’s sales and trading business are commercial and corporate leveraged loans that are
either traded in the market or for which similar loans trade. The Company elected to carry these loans at fair value
since they are actively traded. For the years ended December 31, 2013, 2012, and 2011, the Company recognized
gains of $5 million and $3 million, and losses of $3 million, respectively, in fair value attributable to instrument-
specific credit risk in the Consolidated Statements of Income. The Company is able to obtain fair value estimates for
substantially all of these loans through a third party valuation service that is broadly used by market participants.
While most of the loans are traded in the market, the Company does not believe that trading activity qualifies the
loans as level 1 instruments, as the volume and level of trading activity is subject to variability and the loans are not
exchange-traded, such that the Company believes that level 2 is a more appropriate presentation of the underlying
market activity for the loans. At December 31, 2013 and 2012, $313 million and $357 million, respectively, of loans
related to the Company’s trading business were held in inventory.
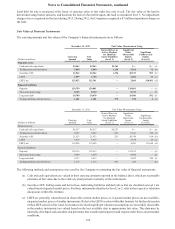
Loans Held for Sale and Loans Held for Investment
Residential LHFS
The Company values certain newly-originated mortgage LHFS predominantly at fair value based upon defined
product criteria. The Company chooses to fair value these mortgage LHFS to eliminate the complexities and inherent
difficulties of achieving hedge accounting and to better align reported results with the underlying economic changes
in value of the loans and related hedge instruments. Origination fees and costs are recognized in earnings when earned
or incurred. The servicing value is included in the fair value of the loan and initially recognized at the time the
Company enters into IRLCs with borrowers. The Company uses derivatives to economically hedge changes in interest
rates and servicing value in the fair value of the loan. The mark-to-market adjustments related to LHFS and the
associated economic hedges are captured in mortgage production related income/(loss).
Level 2 LHFS are primarily agency loans which trade in active secondary markets and are priced using current market
pricing for similar securities adjusted for servicing, interest rate risk, and credit risk. Non-agency residential mortgages
are also included in level 2 LHFS. As disclosed in the tabular level 3 rollforwards, transfers of certain mortgage
LHFS into level 3 during the years ended December 31, 2013 and 2012 were not due to using alternative valuation
approaches, but were largely due to borrower defaults or the identification of other loan defects impacting the
marketability of the loans.
For residential loans that the Company has elected to carry at fair value, the Company considers the component of
the fair value changes due to instrument-specific credit risk, which is intended to be an approximation of the fair
value change attributable to changes in borrower-specific credit risk. For the years ended December 31, 2013, 2012,
and 2011, the Company recognized losses of $2 million, gains of $12 million, and losses of $15 million, respectively,
due to changes in fair value attributable to borrower-specific credit risk in the Consolidated Statements of Income.
In addition to borrower-specific credit risk, there are other, more significant, variables that drive changes in the fair
values of the loans, including interest rates and general conditions in the principal markets for the loans.
Corporate and other LHFS
As discussed in Note 10, “Certain Transfers of Financial Assets and Variable Interest Entities,” the Company has
determined that it is the primary beneficiary of a CLO vehicle, which resulted in the Company consolidating the
loans of that vehicle. Because the CLO trades its loans from time to time and to fairly present the economics of the
CLO, the Company elected to carry the loans of the CLO at fair value. For the years ended December 31, 2013, 2012,