SunTrust 2013 Annual Report Download - page 86
Download and view the complete annual report
Please find page 86 of the 2013 SunTrust annual report below. You can navigate through the pages in the report by either clicking on the pages listed below, or by using the keyword search tool below to find specific information within the annual report.-
 1
1 -
2
-
3
-
4
-
5
-
6
-
7
-
8
-
9
-
10
-
11
-
12
-
13
-
14
-
15
-
16
-
17
-
18
-
19
-
20
-
21
-
22
-
23
-
24
-
25
-
26
-
27
-
28
-
29
-
30
-
31
-
32
-
33
-
34
-
35
-
36
-
37
-
38
-
39
-
40
-
41
-
42
-
43
-
44
-
45
-
46
-
47
-
48
-
49
-
50
-
51
-
52
-
53
-
54
-
55
-
56
-
57
-
58
-
59
-
60
-
61
-
62
-
63
-
64
-
65
-
66
-
67
-
68
-
69
-
70
-
71
-
72
-
73
-
74
-
75
-
 76
76 -
 77
77 -
 78
78 -
 79
79 -
 80
80 -
 81
81 -
 82
82 -
 83
83 -
 84
84 -
 85
85 -
 86
86 -
 87
87 -
 88
88 -
 89
89 -
 90
90 -
 91
91 -
 92
92 -
 93
93 -
 94
94 -
 95
95 -
 96
96 -
97
-
98
-
99
-
100
-
101
-
102
-
103
-
104
-
105
-
106
-
107
-
108
-
109
-
110
-
111
-
112
-
113
-
114
-
115
-
116
-
117
-
118
-
119
-
120
-
121
-
122
-
123
-
124
-
125
-
126
-
127
-
128
-
129
-
130
-
131
-
132
-
133
-
134
-
135
-
136
-
137
-
138
-
139
-
140
-
141
-
142
-
143
-
144
-
145
-
146
-
147
-
148
-
149
-
150
-
151
-
152
-
153
-
154
-
155
-
156
-
157
-
158
-
159
-
160
-
161
-
162
-
163
-
164
-
165
-
166
-
167
-
168
-
169
-
170
-
171
-
172
-
173
-
174
-
175
-
176
-
177
-
178
-
179
-
180
-
181
-
182
-
183
-
184
-
185
-
186
-
187
-
188
-
189
-
190
-
191
-
192
-
193
-
194
-
195
-
196
-
197
-
198
-
199
-
200
-
201
-
202
-
203
-
204
-
205
-
206
-
207
-
208
-
209
-
210
-
211
-
212
-
213
-
214
-
215
-
216
-
217
-
218
-
219
-
220
-
221
-
222
-
223
-
224
-
225
-
226
-
227
-
228
-
229
-
230
-
231
-
232
-
233
-
234
-
235
-
236
 |
 |
70
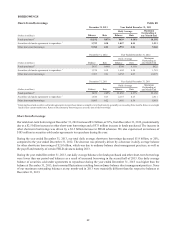
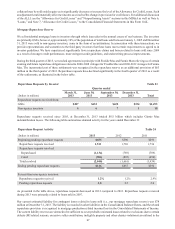
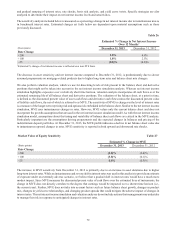
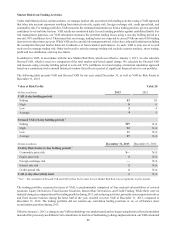
Level 3 Assets and Liabilities Table 25
December 31
(Dollars in millions) 2013 2012
Trading assets and derivatives 1,2 $72 $190
Securities AFS 953 914
LHFS 38
LHFI 302 379
Other intangible assets 31,300 899
Total level 3 assets $2,630 $2,390
Total assets $175,335 $173,442
Total assets measured at fair value 30,562 32,701
Level 3 assets as a percent of total assets 1.5% 1.4%
Level 3 assets as a percent of total assets measured at fair value 8.6% 7.3%
Trading liabilities and derivatives 1,2 4—
Other liabilities 29 31
Total level 3 liabilities $33 $31
Total liabilities $153,913 $152,457
Total liabilities measured at fair value 3,530 3,661
Level 3 liabilities as a percent of total liabilities —% —%
Level 3 liabilities as a percent of total liabilities measured at fair value 0.9% 0.8%
1 In 2013 derivative assets and liabilities previously reported as other assets and liabilities have been reclassified to trading assets and derivatives or trading
liabilities and derivatives.
2 Includes IRLCs.
3 MSRs carried at fair value.
The following discussion provides further information on fair value accounting by balance sheet category including the
difficult to value assets and liabilities displayed in the table above. See Note 18, “Fair Value Election and Measurement,” to
the Consolidated Financial Statements in this Form 10-K for a detailed discussion regarding level 2 and 3 securities and
valuation methodologies for each class of securities.
Trading and Derivative Assets and Liabilities and Securities AFS
In estimating the fair values for the majority of securities AFS and trading instruments, including residual and certain other
retained securitization interests, fair values are based on observable market prices of the same or similar instruments.
Specifically, the majority of trading assets and liabilities are priced by the respective trading desk and the majority of securities
AFS are priced by an independent third party pricing service. We have an internal, yet independent, validation function in
place to evaluate the appropriateness of the marks received from third party pricing services. For trading securities and
securities AFS in active trading markets, this can be accomplished by comparing the marks against two to three other widely
used third party pricing services or sources. For less liquid instruments, we evaluate third party pricing to determine the
reasonableness of the information relative to changes in market data such as any recent trades we executed, market information
received from outside market participants and analysts, and/or changes in the underlying collateral performance.
We also gather third party broker quotes or use industry-standard or proprietary models to estimate the fair value of these
instruments particularly when pricing service information or observable market trades are not available. In most cases, the
current market conditions caused the broker quotes to be indicative and the price indications and broker quotes to be supported
by very limited to no recent market activity. In those instances, we weighted the third party information according to our
judgment of it being a reasonable indication of the instrument's fair value.
When fair values are estimated based on models, we consider relevant market indices that correlate to the underlying collateral,
along with assumptions such as liquidity discounts, interest rates, prepayment speeds, default rates, loss severity rates, and
discount rates. As liquidity returns to certain markets, we have more pricing information from third parties and a reduction
in the need to use internal pricing models to estimate fair value. Even when third party pricing is available, we continued to
classify certain assets as level 3 as we believe that this third party pricing relied on significant unobservable assumptions, as