SunTrust 2013 Annual Report Download - page 55
Download and view the complete annual report
Please find page 55 of the 2013 SunTrust annual report below. You can navigate through the pages in the report by either clicking on the pages listed below, or by using the keyword search tool below to find specific information within the annual report.-
 1
1 -
2
-
3
-
4
-
5
-
6
-
7
-
8
-
9
-
10
-
11
-
12
-
13
-
14
-
15
-
16
-
17
-
18
-
19
-
20
-
21
-
22
-
23
-
24
-
25
-
26
-
27
-
28
-
29
-
30
-
31
-
32
-
33
-
34
-
35
-
36
-
37
-
38
-
39
-
40
-
41
-
42
-
43
-
44
-
 45
45 -
 46
46 -
 47
47 -
 48
48 -
 49
49 -
 50
50 -
 51
51 -
 52
52 -
 53
53 -
 54
54 -
 55
55 -
 56
56 -
 57
57 -
 58
58 -
 59
59 -
 60
60 -
 61
61 -
 62
62 -
 63
63 -
 64
64 -
 65
65 -
66
-
67
-
68
-
69
-
70
-
71
-
72
-
73
-
74
-
75
-
76
-
77
-
78
-
79
-
80
-
81
-
82
-
83
-
84
-
85
-
86
-
87
-
88
-
89
-
90
-
91
-
92
-
93
-
94
-
95
-
96
-
97
-
98
-
99
-
100
-
101
-
102
-
103
-
104
-
105
-
106
-
107
-
108
-
109
-
110
-
111
-
112
-
113
-
114
-
115
-
116
-
117
-
118
-
119
-
120
-
121
-
122
-
123
-
124
-
125
-
126
-
127
-
128
-
129
-
130
-
131
-
132
-
133
-
134
-
135
-
136
-
137
-
138
-
139
-
140
-
141
-
142
-
143
-
144
-
145
-
146
-
147
-
148
-
149
-
150
-
151
-
152
-
153
-
154
-
155
-
156
-
157
-
158
-
159
-
160
-
161
-
162
-
163
-
164
-
165
-
166
-
167
-
168
-
169
-
170
-
171
-
172
-
173
-
174
-
175
-
176
-
177
-
178
-
179
-
180
-
181
-
182
-
183
-
184
-
185
-
186
-
187
-
188
-
189
-
190
-
191
-
192
-
193
-
194
-
195
-
196
-
197
-
198
-
199
-
200
-
201
-
202
-
203
-
204
-
205
-
206
-
207
-
208
-
209
-
210
-
211
-
212
-
213
-
214
-
215
-
216
-
217
-
218
-
219
-
220
-
221
-
222
-
223
-
224
-
225
-
226
-
227
-
228
-
229
-
230
-
231
-
232
-
233
-
234
-
235
-
236
 |
 |

39
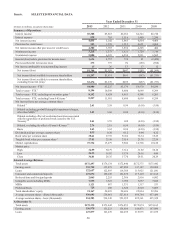
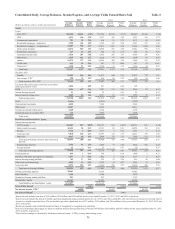
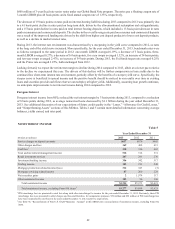
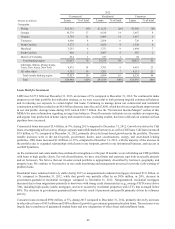
Consolidated Daily Average Balances, Income/Expense, and Average Yields Earned/Rates Paid Table 2
2013 2012 2011
(Dollars in millions; yields on taxable-equivalent basis)
Average
Balances
Income/
Expense
Yields/
Rates
Average
Balances
Income/
Expense
Yields/
Rates
Average
Balances
Income/
Expense
Yields/
Rates
Assets
Loans: 1
C&I - FTE 2$54,788 $2,181 3.98% $51,228 $2,329 4.55% $46,027 $2,368 5.14%
CRE 4,513 146 3.24 4,517 165 3.65 5,323 198 3.72
Commercial construction 701 24 3.46 816 31 3.79 1,173 45 3.85
Residential mortgages - guaranteed 3,708 106 2.85 5,589 165 2.96 4,587 157 3.42
Residential mortgages - nonguaranteed 23,007 958 4.17 22,621 1,023 4.52 21,926 1,088 4.96
Home equity products 14,474 525 3.63 14,962 551 3.68 15,841 594 3.75
Residential construction 549 27 4.91 692 36 5.17 862 45 5.21
Guaranteed student loans 5,426 207 3.82 6,863 265 3.87 4,920 209 4.26
Other direct 2,535 111 4.37 2,226 97 4.34 1,868 89 4.75
Indirect 11,072 377 3.41 10,468 403 3.85 9,690 439 4.53
Credit cards 646 62 9.66 567 57 10.06 511 59 11.61
Nonaccrual 31,238 33 2.63 2,344 31 1.32 3,580 34 0.95
Total loans 122,657 4,757 3.88 122,893 5,153 4.19 116,308 5,325 4.58
Securities AFS:
Taxable 22,383 569 2.54 21,875 640 2.93 23,973 770 3.21
Tax-exempt - FTE 2258 13 5.18 368 20 5.33 502 28 5.48
Total securities AFS - FTE 22,641 582 2.57 22,243 660 2.97 24,475 798 3.26
Fed funds sold and securities borrowed or purchased
under agreements to resell 1,024 — 0.02 897 — 0.04 992 — —
LHFS 3,096 107 3.44 3,267 112 3.41 2,255 93 4.13
Interest-bearing deposits 21 — 0.09 22 — 0.21 22 — 0.15
Interest earning trading assets 4,289 69 1.61 4,157 65 1.55 3,750 79 2.10
Total earning assets 153,728 5,515 3.59 153,479 5,990 3.90 147,802 6,295 4.26
ALLL (2,121) (2,295)(2,702)
Cash and due from banks 4,530 5,482 5,203
Other assets 14,287 14,854 16,831
Noninterest earning trading assets 1,660 2,184 2,708
Unrealized gains on securities AFS 413 2,430 2,598
Total assets $172,497 $176,134 $172,440
Liabilities and Shareholders’ Equity
Interest-bearing deposits:
NOW accounts $26,083 $17 0.07% $25,155 $23 0.09% $24,751 $35 0.14%
Money market accounts 42,655 54 0.13 42,101 88 0.21 42,854 161 0.38
Savings 5,740 3 0.05 5,113 5 0.10 4,535 7 0.15
Consumer time 9,018 102 1.13 10,597 145 1.37 12,451 198 1.59
Other time 4,937 64 1.29 5,954 91 1.52 7,036 122 1.73
Total interest-bearing consumer and commercial
deposits
88,433 240 0.27 88,920 352 0.40 91,627 523 0.57
Brokered time deposits 2,030 51 2.49 2,204 77 3.42 2,306 101 4.38
Foreign deposits 35 — 0.13 51 — 0.17 80 — 0.57
Total interest-bearing deposits 90,498 291 0.32 91,175 429 0.47 94,013 624 0.66
Funds purchased 639 1 0.10 798 1 0.11 1,038 2 0.13
Securities sold under agreements to repurchase 1,857 3 0.14 1,602 3 0.18 2,157 3 0.15
Interest-bearing trading liabilities 705 17 2.45 676 15 2.24 851 26 3.04
Other short-term borrowings 4,953 13 0.26 6,952 18 0.27 3,465 12 0.36
Long-term debt 9,872 210 2.12 11,806 299 2.53 13,496 449 3.33
Total interest-bearing liabilities 108,524 535 0.49 113,009 765 0.68 115,020 1,116 0.97
Noninterest-bearing deposits 38,643 37,329 31,045
Other liabilities 3,602 4,348 3,972
Noninterest-bearing trading liabilities 561 953 1,707
Shareholders’ equity 21,167 20,495 20,696
Total liabilities and shareholders’ equity $172,497 $176,134 $172,440
Interest Rate Spread 3.10% 3.22% 3.29%
Net interest income - FTE 4$4,980 $5,225 $5,179
Net Interest Margin53.24% 3.40% 3.50%
1 Interest income includes loan fees of $153 million, $112 million, and $138 million for the years ended December 31, 2013, 2012, and 2011, respectively.
2 Interest income includes the effects of taxable-equivalent adjustments using a federal income tax rate of 35% and, where applicable, state income taxes to increase tax-exempt interest
income to a taxable-equivalent basis. The net taxable-equivalent adjustments were $127 million, $123 million, and $114 million for the years ended December 31, 2013, 2012, and
2011, respectively.
3 Income on consumer and residential nonaccrual loans, if recognized, is recognized on a cash basis.
4 Derivative instruments that manage our interest-sensitivity position increased net interest income $444 million, $528 million, and $639 million for the years ended December 31, 2013,
2012, and 2011, respectively.
5 The net interest margin is calculated by dividing net interest income – FTE by average total earning assets.