SunTrust 2013 Annual Report Download - page 218
Download and view the complete annual report
Please find page 218 of the 2013 SunTrust annual report below. You can navigate through the pages in the report by either clicking on the pages listed below, or by using the keyword search tool below to find specific information within the annual report.-
 1
1 -
2
-
3
-
4
-
5
-
6
-
7
-
8
-
9
-
10
-
11
-
12
-
13
-
14
-
15
-
16
-
17
-
18
-
19
-
20
-
21
-
22
-
23
-
24
-
25
-
26
-
27
-
28
-
29
-
30
-
31
-
32
-
33
-
34
-
35
-
36
-
37
-
38
-
39
-
40
-
41
-
42
-
43
-
44
-
45
-
46
-
47
-
48
-
49
-
50
-
51
-
52
-
53
-
54
-
55
-
56
-
57
-
58
-
59
-
60
-
61
-
62
-
63
-
64
-
65
-
66
-
67
-
68
-
69
-
70
-
71
-
72
-
73
-
74
-
75
-
76
-
77
-
78
-
79
-
80
-
81
-
82
-
83
-
84
-
85
-
86
-
87
-
88
-
89
-
90
-
91
-
92
-
93
-
94
-
95
-
96
-
97
-
98
-
99
-
100
-
101
-
102
-
103
-
104
-
105
-
106
-
107
-
108
-
109
-
110
-
111
-
112
-
113
-
114
-
115
-
116
-
117
-
118
-
119
-
120
-
121
-
122
-
123
-
124
-
125
-
126
-
127
-
128
-
129
-
130
-
131
-
132
-
133
-
134
-
135
-
136
-
137
-
138
-
139
-
140
-
141
-
142
-
143
-
144
-
145
-
146
-
147
-
148
-
149
-
150
-
151
-
152
-
153
-
154
-
155
-
156
-
157
-
158
-
159
-
160
-
161
-
162
-
163
-
164
-
165
-
166
-
167
-
168
-
169
-
170
-
171
-
172
-
173
-
174
-
175
-
176
-
177
-
178
-
179
-
180
-
181
-
182
-
183
-
184
-
185
-
186
-
187
-
188
-
189
-
190
-
191
-
192
-
193
-
194
-
195
-
196
-
197
-
198
-
199
-
200
-
201
-
202
-
203
-
204
-
205
-
206
-
207
-
 208
208 -
 209
209 -
 210
210 -
 211
211 -
 212
212 -
 213
213 -
 214
214 -
 215
215 -
 216
216 -
 217
217 -
 218
218 -
 219
219 -
 220
220 -
 221
221 -
 222
222 -
 223
223 -
 224
224 -
 225
225 -
 226
226 -
 227
227 -
 228
228 -
229
-
230
-
231
-
232
-
233
-
234
-
235
-
236
 |
 |

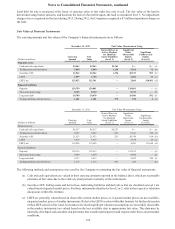
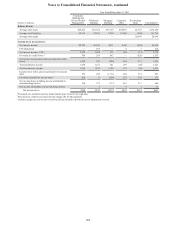
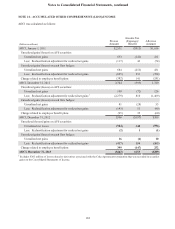
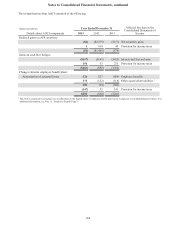
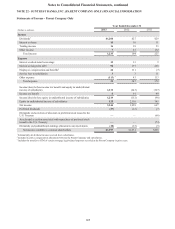
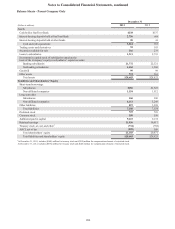
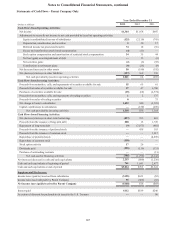
Notes to Consolidated Financial Statements, continued
202
Year Ended December 31, 2011
(Dollars in millions)
Consumer
Banking and
Private Wealth
Management
Wholesale
Banking
Mortgage
Banking
Corporate
Other
Reconciling
Items Consolidated
Balance Sheets:
Average total assets $45,221 $61,323 $33,719 $30,876 $1,301 $172,440
Average total liabilities 85,335 47,181 3,838 15,598 (208) 151,744
Average total equity — — — — 20,696 20,696
Statements of Income/(loss):
Net interest income $2,729 $1,385 $471 $498 ($18) $5,065
FTE adjustment — 107 — 6 1 114
Net interest income - FTE 12,729 1,492 471 504 (17) 5,179
Provision for credit losses 2789 559 693 — (528) 1,513
Net interest income/(loss) after provision for credit
losses 1,940 933 (222) 504 511 3,666
Total noninterest income 1,678 1,231 241 297 (26) 3,421
Total noninterest expense 3,066 1,874 1,190 133 (29) 6,234
Income/(loss) before provision/(benefit) for income
taxes 552 290 (1,171) 668 514 853
Provision/(benefit) for income taxes 3202 17 (454) 227 201 193
Net income/(loss) including income attributable to
noncontrolling interest 350 273 (717) 441 313 660
Net income attributable to noncontrolling interest — 3 — 9 1 13
Net income/(loss) $350 $270 ($717) $432 $312 $647
1 Presented on a matched maturity funds transfer price basis for the segments.
2 Provision for credit losses represents net charge-offs for the segments.
3 Includes regular income tax provision/(benefit) and taxable-equivalent income adjustment reversal.