SunTrust 2013 Annual Report Download - page 177
Download and view the complete annual report
Please find page 177 of the 2013 SunTrust annual report below. You can navigate through the pages in the report by either clicking on the pages listed below, or by using the keyword search tool below to find specific information within the annual report.-
 1
1 -
2
-
3
-
4
-
5
-
6
-
7
-
8
-
9
-
10
-
11
-
12
-
13
-
14
-
15
-
16
-
17
-
18
-
19
-
20
-
21
-
22
-
23
-
24
-
25
-
26
-
27
-
28
-
29
-
30
-
31
-
32
-
33
-
34
-
35
-
36
-
37
-
38
-
39
-
40
-
41
-
42
-
43
-
44
-
45
-
46
-
47
-
48
-
49
-
50
-
51
-
52
-
53
-
54
-
55
-
56
-
57
-
58
-
59
-
60
-
61
-
62
-
63
-
64
-
65
-
66
-
67
-
68
-
69
-
70
-
71
-
72
-
73
-
74
-
75
-
76
-
77
-
78
-
79
-
80
-
81
-
82
-
83
-
84
-
85
-
86
-
87
-
88
-
89
-
90
-
91
-
92
-
93
-
94
-
95
-
96
-
97
-
98
-
99
-
100
-
101
-
102
-
103
-
104
-
105
-
106
-
107
-
108
-
109
-
110
-
111
-
112
-
113
-
114
-
115
-
116
-
117
-
118
-
119
-
120
-
121
-
122
-
123
-
124
-
125
-
126
-
127
-
128
-
129
-
130
-
131
-
132
-
133
-
134
-
135
-
136
-
137
-
138
-
139
-
140
-
141
-
142
-
143
-
144
-
145
-
146
-
147
-
148
-
149
-
150
-
151
-
152
-
153
-
154
-
155
-
156
-
157
-
158
-
159
-
160
-
161
-
162
-
163
-
164
-
165
-
166
-
 167
167 -
 168
168 -
 169
169 -
 170
170 -
 171
171 -
 172
172 -
 173
173 -
 174
174 -
 175
175 -
 176
176 -
 177
177 -
 178
178 -
 179
179 -
 180
180 -
 181
181 -
 182
182 -
 183
183 -
 184
184 -
 185
185 -
 186
186 -
 187
187 -
188
-
189
-
190
-
191
-
192
-
193
-
194
-
195
-
196
-
197
-
198
-
199
-
200
-
201
-
202
-
203
-
204
-
205
-
206
-
207
-
208
-
209
-
210
-
211
-
212
-
213
-
214
-
215
-
216
-
217
-
218
-
219
-
220
-
221
-
222
-
223
-
224
-
225
-
226
-
227
-
228
-
229
-
230
-
231
-
232
-
233
-
234
-
235
-
236
 |
 |
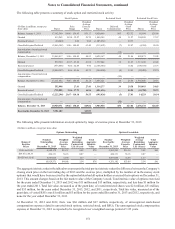
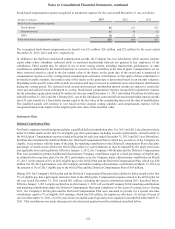
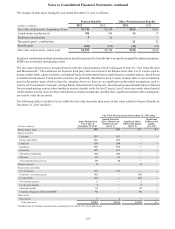
Notes to Consolidated Financial Statements, continued
161
exists a legal right of offset with that counterparty, the Company considers its exposure to the counterparty to be the net market
value of its derivative positions with that counterparty if an asset, adjusted for held collateral. At December 31, 2013, these net
derivative asset positions were $1.0 billion, representing the $1.5 billion of derivative net gains adjusted for cash and other
collateral of $0.5 billion that the Company held in relation to these gain positions. At December 31, 2012, net derivative asset
positions were $1.8 billion, representing $2.6 billion of derivative net gains, adjusted for cash and other collateral of $0.8 billion
that the Company held in relation to these gain positions.
Derivatives also expose the Company to market risk. Market risk is the adverse effect that a change in market factors, such as
interest rates, currency rates, equity prices, or implied volatility, has on the value of a derivative. The Company manages the
market risk associated with its derivatives by establishing and monitoring limits on the types and degree of risk that may be
undertaken. The Company continually measures this risk associated with its derivatives designated as trading instruments using
a VAR methodology.
Derivative instruments are priced with observable market assumptions at a mid-market valuation point, with appropriate valuation
adjustments for liquidity and credit risk. For purposes of valuation adjustments to its derivative positions, the Company has
evaluated liquidity premiums that may be demanded by market participants, as well as the credit risk of its counterparties and
its own credit. The Company has considered factors such as the likelihood of default by itself and its counterparties, its net
exposures, and remaining maturities in determining the appropriate fair value adjustments to recognize. Generally, the expected
loss of each counterparty is estimated using the Company’s internal risk rating system. The risk rating system utilizes counterparty-
specific PD and LGD estimates to derive the expected loss. For counterparties that are rated by national rating agencies, those
ratings are also considered in estimating the credit risk. Additionally, counterparty exposure is evaluated by offsetting positions
that are subject to master netting arrangements, as well as by considering the amount of marketable collateral securing the
position. All counterparties and defined exposure limits are explicitly approved. Counterparties are regularly reviewed and
appropriate business action is taken to adjust the exposure to certain counterparties, as necessary. This approach is also used by
the Company to estimate its own credit risk on derivative liability positions. The Company adjusted the net fair value of its
derivative contracts for estimates of net counterparty credit risk by approximately $16 million and $29 million at December 31,
2013 and 2012, respectively.
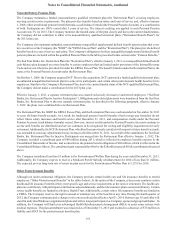
Currently the majority of the Company’s derivatives contain contingencies that relate to the creditworthiness of the Bank. These
contingencies, which are contained in industry standard master netting agreements, may be considered events of default. Should
the Bank be in default under any of these provisions, the Bank’s counterparties would be permitted to close-out net at amounts
that would approximate the then-fair values of the derivatives resulting in a single sum due by one party to the other. The
counterparties would have the right to apply any collateral posted by the Bank against any net amount owed by the Bank.
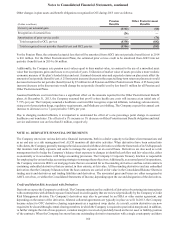
Additionally, certain of the Company’s derivative liability positions, totaling $941 million in fair value at December 31, 2013
and $1.3 billion at December 31, 2012, contain provisions conditioned on downgrades of the Bank’s credit rating. These
provisions, if triggered, would either give rise to an ATE that permits the counterparties to close-out net and apply collateral or,
where a CSA is present, require the Bank to post additional collateral. At December 31, 2013, the Bank carried senior long-term
debt ratings of A3/BBB+ from three of the major ratings agencies. At the current rating level, ATEs have been triggered for
approximately $3 million in fair value liabilities at December 31, 2013. For illustrative purposes, if the Bank were downgraded
to BB+, ATEs would be triggered in derivative liability contracts that had a total fair value of $9 million at December 31, 2013;
ATEs do not exist at lower ratings levels. At December 31, 2013, $938 million in fair value of derivative liabilities were subject
to CSAs, against which the Bank has posted $864 million in collateral, primarily in the form of cash. If requested by the
counterparty pursuant to the terms of the CSA, the Bank would be required to post estimated additional collateral against these
contracts at December 31, 2013, of $10 million if the Bank were downgraded to Baa3/BBB-, and any further downgrades to
Ba1/BB+ or below do not contain predetermined collateral posting levels.
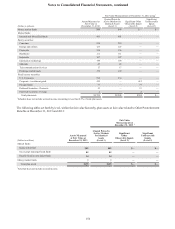
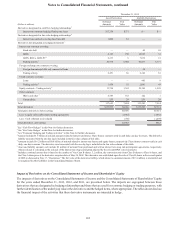
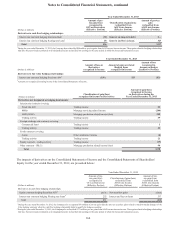
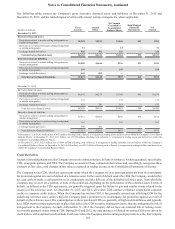
Notional and Fair Value of Derivative Positions
The following tables present the Company’s derivative positions at December 31, 2013 and 2012. The notional amounts in the
tables are presented on a gross basis and have been classified within Asset Derivatives or Liability Derivatives based on the
estimated fair value of the individual contract at December 31, 2013 and 2012. Gross positive and gross negative fair value
amounts associated with respective notional amounts are presented without consideration of any netting agreements, including
collateral arrangements. For contracts constituting a combination of options that contain a written option and a purchased option
(such as a collar), the notional amount of each option is presented separately, with the purchased notional amount generally
being presented as an Asset Derivative and the written notional amount being presented as a Liability Derivative. For contracts
that contain a combination of options, the fair value is generally presented as a single value with the purchased notional amount
if the combined fair value is positive, and with the written notional amount, if the combined fair value is negative.