SunTrust 2013 Annual Report Download - page 195
Download and view the complete annual report
Please find page 195 of the 2013 SunTrust annual report below. You can navigate through the pages in the report by either clicking on the pages listed below, or by using the keyword search tool below to find specific information within the annual report.-
 1
1 -
2
-
3
-
4
-
5
-
6
-
7
-
8
-
9
-
10
-
11
-
12
-
13
-
14
-
15
-
16
-
17
-
18
-
19
-
20
-
21
-
22
-
23
-
24
-
25
-
26
-
27
-
28
-
29
-
30
-
31
-
32
-
33
-
34
-
35
-
36
-
37
-
38
-
39
-
40
-
41
-
42
-
43
-
44
-
45
-
46
-
47
-
48
-
49
-
50
-
51
-
52
-
53
-
54
-
55
-
56
-
57
-
58
-
59
-
60
-
61
-
62
-
63
-
64
-
65
-
66
-
67
-
68
-
69
-
70
-
71
-
72
-
73
-
74
-
75
-
76
-
77
-
78
-
79
-
80
-
81
-
82
-
83
-
84
-
85
-
86
-
87
-
88
-
89
-
90
-
91
-
92
-
93
-
94
-
95
-
96
-
97
-
98
-
99
-
100
-
101
-
102
-
103
-
104
-
105
-
106
-
107
-
108
-
109
-
110
-
111
-
112
-
113
-
114
-
115
-
116
-
117
-
118
-
119
-
120
-
121
-
122
-
123
-
124
-
125
-
126
-
127
-
128
-
129
-
130
-
131
-
132
-
133
-
134
-
135
-
136
-
137
-
138
-
139
-
140
-
141
-
142
-
143
-
144
-
145
-
146
-
147
-
148
-
149
-
150
-
151
-
152
-
153
-
154
-
155
-
156
-
157
-
158
-
159
-
160
-
161
-
162
-
163
-
164
-
165
-
166
-
167
-
168
-
169
-
170
-
171
-
172
-
173
-
174
-
175
-
176
-
177
-
178
-
179
-
180
-
181
-
182
-
183
-
184
-
 185
185 -
 186
186 -
 187
187 -
 188
188 -
 189
189 -
 190
190 -
 191
191 -
 192
192 -
 193
193 -
 194
194 -
 195
195 -
 196
196 -
 197
197 -
 198
198 -
 199
199 -
 200
200 -
 201
201 -
 202
202 -
 203
203 -
 204
204 -
 205
205 -
206
-
207
-
208
-
209
-
210
-
211
-
212
-
213
-
214
-
215
-
216
-
217
-
218
-
219
-
220
-
221
-
222
-
223
-
224
-
225
-
226
-
227
-
228
-
229
-
230
-
231
-
232
-
233
-
234
-
235
-
236
 |
 |

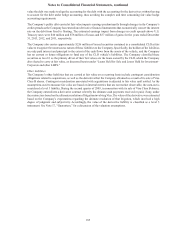
Notes to Consolidated Financial Statements, continued
179
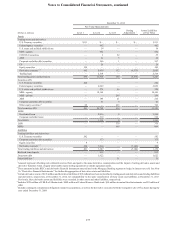
The following tables present the change in fair value during the years ended December 31, 2013, 2012, and 2011, of financial
instruments for which the FVO has been elected, as well as MSRs. The tables do not reflect the change in fair value attributable
to the related economic hedges the Company used to mitigate the market-related risks associated with the financial instruments.
Generally, the changes in the fair value of economic hedges are also recognized in trading income, mortgage production related
income/(loss), or mortgage servicing related income, as appropriate, and are designed to partially offset the change in fair
value of the financial instruments referenced in the tables below. The Company’s economic hedging activities are deployed
at both the instrument and portfolio level.
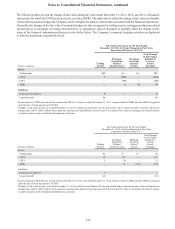
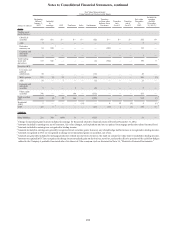
Fair Value Gain/(Loss) for the Year Ended
December 31, 2013, for Items Measured at Fair Value
Pursuant to Election of the FVO
(Dollars in millions)
Trading
Income
Mortgage
Production
Related
Income/(Loss) 1
Mortgage
Servicing
Related
Income
Total Changes
in Fair Values
Included in
Current
Period
Earnings 2
Assets:
Trading loans $13 $— $— $13
LHFS 1 (135) — (134)
LHFI — (10) — (10)
MSRs — 4 50 54
Liabilities:
Brokered time deposits 8——8
Long-term debt 36 — — 36
1 Income related to LHFS does not include income from IRLCs. For the year ended December 31, 2013, income related to MSRs includes MSRs recognized
upon the sale of loans reported at LOCOM.
2 Changes in fair value for the year ended December 31, 2013 exclude accrued interest for the period then ended. Interest income or interest expense on
trading loans, LHFS, LHFI, brokered time deposits, and long-term debt that have been elected to be carried at fair value are recognized in interest income
or interest expense in the Consolidated Statements of Income.
Fair Value Gain/(Loss) for the Year Ended
December 31, 2012, for Items Measured at Fair Value
Pursuant to Election of the FVO
(Dollars in millions)
Trading
Income
Mortgage
Production
Related
Income/(Loss) 1
Mortgage
Servicing
Related
Income
Total Changes
in Fair Values
Included in
Current
Period
Earnings 2
Assets:
Trading loans $8 $— $— $8
LHFS 10 161 — 171
LHFI 120—21
MSRs — 31 (353) (322)
Liabilities:
Brokered time deposits 5 — — 5
Long-term debt (65) — — (65)
1 Income related to LHFS does not include income from IRLCs. For the year ended December 31, 2012, income related to MSRs includes MSRs recognized
upon the sale of loans reported at LOCOM.
2 Changes in fair value for the year ended December 31, 2012 exclude accrued interest for the period then ended. Interest income or interest expense on
trading loans, LHFS, LHFI, brokered time deposits, and long-term debt that have been elected to be carried at fair value are recognized in interest income
or interest expense in the Consolidated Statements of Income.