SunTrust 2013 Annual Report Download - page 94
Download and view the complete annual report
Please find page 94 of the 2013 SunTrust annual report below. You can navigate through the pages in the report by either clicking on the pages listed below, or by using the keyword search tool below to find specific information within the annual report.-
 1
1 -
2
-
3
-
4
-
5
-
6
-
7
-
8
-
9
-
10
-
11
-
12
-
13
-
14
-
15
-
16
-
17
-
18
-
19
-
20
-
21
-
22
-
23
-
24
-
25
-
26
-
27
-
28
-
29
-
30
-
31
-
32
-
33
-
34
-
35
-
36
-
37
-
38
-
39
-
40
-
41
-
42
-
43
-
44
-
45
-
46
-
47
-
48
-
49
-
50
-
51
-
52
-
53
-
54
-
55
-
56
-
57
-
58
-
59
-
60
-
61
-
62
-
63
-
64
-
65
-
66
-
67
-
68
-
69
-
70
-
71
-
72
-
73
-
74
-
75
-
76
-
77
-
78
-
79
-
80
-
81
-
82
-
83
-
 84
84 -
 85
85 -
 86
86 -
 87
87 -
 88
88 -
 89
89 -
 90
90 -
 91
91 -
 92
92 -
 93
93 -
 94
94 -
 95
95 -
 96
96 -
 97
97 -
 98
98 -
 99
99 -
 100
100 -
 101
101 -
 102
102 -
 103
103 -
 104
104 -
105
-
106
-
107
-
108
-
109
-
110
-
111
-
112
-
113
-
114
-
115
-
116
-
117
-
118
-
119
-
120
-
121
-
122
-
123
-
124
-
125
-
126
-
127
-
128
-
129
-
130
-
131
-
132
-
133
-
134
-
135
-
136
-
137
-
138
-
139
-
140
-
141
-
142
-
143
-
144
-
145
-
146
-
147
-
148
-
149
-
150
-
151
-
152
-
153
-
154
-
155
-
156
-
157
-
158
-
159
-
160
-
161
-
162
-
163
-
164
-
165
-
166
-
167
-
168
-
169
-
170
-
171
-
172
-
173
-
174
-
175
-
176
-
177
-
178
-
179
-
180
-
181
-
182
-
183
-
184
-
185
-
186
-
187
-
188
-
189
-
190
-
191
-
192
-
193
-
194
-
195
-
196
-
197
-
198
-
199
-
200
-
201
-
202
-
203
-
204
-
205
-
206
-
207
-
208
-
209
-
210
-
211
-
212
-
213
-
214
-
215
-
216
-
217
-
218
-
219
-
220
-
221
-
222
-
223
-
224
-
225
-
226
-
227
-
228
-
229
-
230
-
231
-
232
-
233
-
234
-
235
-
236
 |
 |
78
Operational Risk Management
We face ongoing and emerging risks and regulations related to the activities that surround the delivery of banking and financial
products. Coupled with external influences such as market conditions, fraudulent activities, disasters, cyber attacks and other
security risks, country risk, and legal risk, the potential for operational and reputational loss remains elevated.
We believe that effective management of operational risk, defined as the risk of loss resulting from inadequate or failed internal
processes, people and systems, or from external events, plays a major role in both the level and the stability of our profitability.
Our Operational Risk Management function oversees an enterprise-wide framework intended to identify, assess, control,
monitor, and report on operational risks Company-wide. These processes support our goals to minimize future operational
losses and strengthen our performance by maintaining sufficient capital to absorb operational losses that are incurred.
Operational Risk Management is overseen by our CORO, who reports directly to the CRO. The operational risk governance
structure includes an operational risk manager and support staff within each business segment and corporate function. These
risk managers are responsible for execution of risk management within their areas in compliance with CRM's policies and
procedures.
Market Risk Management
Market risk refers to potential losses arising from changes in interest rates, foreign exchange rates, equity prices, commodity
prices, and other relevant market rates or prices. Interest rate risk, defined as the exposure of net interest income and MVE
to adverse movements in interest rates, is our primary market risk and mainly arises from the structure of our balance sheet,
which includes all loans. Variable rate loans, prior to any hedging related actions, are approximately 56% of total loans and
after giving consideration to hedging related actions, are approximately 43% of total loans. We are also exposed to market
risk in our trading instruments carried at fair value. ALCO meets regularly and is responsible for reviewing our open positions
and establishing policies to monitor and limit exposure to market risk.
Market Risk from Non-Trading Activities
The primary goal of interest rate risk management is to control exposure to interest rate risk, within policy limits approved
by the Board. These limits and guidelines reflect our tolerance for interest rate risk over both short-term and long-term horizons.
No limit breaches occurred during 2013.
The major sources of our non-trading interest rate risk are timing differences in the maturity and repricing characteristics of
assets and liabilities, changes in the shape of the yield curve, and the potential exercise of explicit or embedded options. We
measure these risks and their impact by identifying and quantifying exposures through the use of sophisticated simulation
and valuation models, which, as described in additional detail below, are employed by management to understand net interest
income at risk and MVE at risk. These measures show that our interest rate risk profile is slightly asset sensitive at December 31,
2013.
MVE and net interest income sensitivity are complementary interest rate risk metrics and should be viewed together. Net
interest income sensitivity captures asset and liability repricing mismatches for the first year inclusive of forecast balance
sheet changes and is considered a shorter term measure, while MVE sensitivity captures mismatches within the period end
balance sheets through the financial instruments' respective maturities and is considered a longer term measure.
A positive net interest income sensitivity in a rising rate environment indicates that over the forecast horizon of one year,
asset based income will increase more quickly than liability based expense due to balance sheet composition. A negative MVE
sensitivity in a rising rate environment indicates that the value of financial assets will decrease more than the value of financial
liabilities.
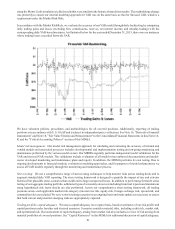
One of the primary methods that we use to quantify and manage interest rate risk is simulation analysis, which we use to
model net interest income from assets, liabilities, and derivative positions under various interest rate scenarios and balance
sheet structures. This analysis measures the sensitivity of net interest income over a two year time horizon, which differs from
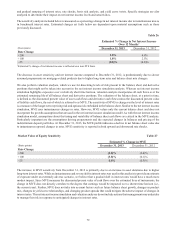
the interest rate sensitivities in Table 26, which are prescribed to be over a one year time horizon. Key assumptions in the
simulation analysis (and in the valuation analysis discussed below) relate to the behavior of interest rates and spreads, the
changes in product balances, and the behavior of loan and deposit clients in different rate environments. This analysis
incorporates several assumptions, the most material of which relate to the repricing characteristics and balance fluctuations
of deposits with indeterminate or non-contractual maturities.
As the future path of interest rates cannot be known, we use simulation analysis to project net interest income under various
scenarios including implied forward and deliberately extreme and perhaps unlikely scenarios. The analyses may include rapid