SunTrust 2013 Annual Report Download - page 156
Download and view the complete annual report
Please find page 156 of the 2013 SunTrust annual report below. You can navigate through the pages in the report by either clicking on the pages listed below, or by using the keyword search tool below to find specific information within the annual report.-
 1
1 -
2
-
3
-
4
-
5
-
6
-
7
-
8
-
9
-
10
-
11
-
12
-
13
-
14
-
15
-
16
-
17
-
18
-
19
-
20
-
21
-
22
-
23
-
24
-
25
-
26
-
27
-
28
-
29
-
30
-
31
-
32
-
33
-
34
-
35
-
36
-
37
-
38
-
39
-
40
-
41
-
42
-
43
-
44
-
45
-
46
-
47
-
48
-
49
-
50
-
51
-
52
-
53
-
54
-
55
-
56
-
57
-
58
-
59
-
60
-
61
-
62
-
63
-
64
-
65
-
66
-
67
-
68
-
69
-
70
-
71
-
72
-
73
-
74
-
75
-
76
-
77
-
78
-
79
-
80
-
81
-
82
-
83
-
84
-
85
-
86
-
87
-
88
-
89
-
90
-
91
-
92
-
93
-
94
-
95
-
96
-
97
-
98
-
99
-
100
-
101
-
102
-
103
-
104
-
105
-
106
-
107
-
108
-
109
-
110
-
111
-
112
-
113
-
114
-
115
-
116
-
117
-
118
-
119
-
120
-
121
-
122
-
123
-
124
-
125
-
126
-
127
-
128
-
129
-
130
-
131
-
132
-
133
-
134
-
135
-
136
-
137
-
138
-
139
-
140
-
141
-
142
-
143
-
144
-
145
-
 146
146 -
 147
147 -
 148
148 -
 149
149 -
 150
150 -
 151
151 -
 152
152 -
 153
153 -
 154
154 -
 155
155 -
 156
156 -
 157
157 -
 158
158 -
 159
159 -
 160
160 -
 161
161 -
 162
162 -
 163
163 -
 164
164 -
 165
165 -
 166
166 -
167
-
168
-
169
-
170
-
171
-
172
-
173
-
174
-
175
-
176
-
177
-
178
-
179
-
180
-
181
-
182
-
183
-
184
-
185
-
186
-
187
-
188
-
189
-
190
-
191
-
192
-
193
-
194
-
195
-
196
-
197
-
198
-
199
-
200
-
201
-
202
-
203
-
204
-
205
-
206
-
207
-
208
-
209
-
210
-
211
-
212
-
213
-
214
-
215
-
216
-
217
-
218
-
219
-
220
-
221
-
222
-
223
-
224
-
225
-
226
-
227
-
228
-
229
-
230
-
231
-
232
-
233
-
234
-
235
-
236
 |
 |

Notes to Consolidated Financial Statements, continued
140
CDO Securities
The Company has transferred bank trust preferred securities in securitization transactions. The Company's maximum
exposure to loss at December 31, 2013 and 2012, includes current senior interests held in trading securities, which
have fair values of $54 million and $52 million, respectively.
As further discussed in Note 18, "Fair Value Election and Measurement," the Company valued these interests by
constructing a pricing matrix of values based on a range of overcollateralization levels that are derived from discussions
with the dealer community along with limited trade data. The primary inputs and assumptions considered by the
Company in valuing these retained interests were overcollateralization levels (impacted by credit losses) and the
discount margin over LIBOR. While all the underlying collateral is currently eligible for repayment by the obligor,
given the nature of the collateral and the current repricing environment, the Company assumed no prepayment would
occur before the final maturity, which is approximately 20 years on a weighted average basis. The expected discount
margin over LIBOR ranged from 4.3% to 5.5% at December 31, 2013 based on discussion with the dealer community
with limited trade data adjusted for specific deal factors. At December 31, 2013, a 10% and 20% adverse change in
the assumed market yield results in declines of approximately $4 million and $7 million, respectively, in the fair
value of these securities. In evaluating the impact of credit losses, consideration was given to the underlying collateral
of the VIEs, which is highly concentrated, and as a result, the default or deferral of certain large exposures adversely
impacts the value of the interests. The Company estimates that if each of the VIEs in which the Company holds
retained positions experienced three additional large deferrals or defaults, it should not have a significant impact on
the fair value of the retained securities.
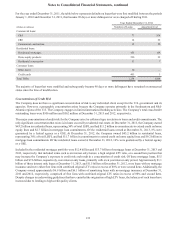
At December 31, 2013 and 2012, the total assets of the trust preferred CDO entities in which the Company has
remaining exposure to loss were $816 million and $1.2 billion, respectively. The Company determined that it was
not the primary beneficiary of any of these VIEs as the Company lacks the power to direct the significant activities
of any of the VIEs. Subsequent to December 31, 2013, the Company sold all interests in these VIEs.
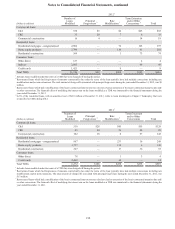
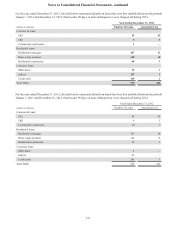
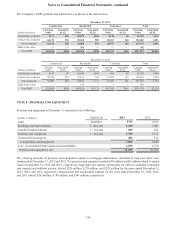
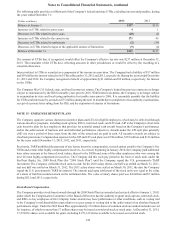
The following tables present certain information for the years ended December 31, related to the Company’s asset transfers
in which it has continuing economic involvement.
(Dollars in millions) 2013 2012 2011
Cash flows on interests held1:
Residential Mortgage Loans2$32 $27 $48
Commercial and Corporate Loans 111
CDO Securities 322
Total cash flows on interests held $36 $30 $51
Servicing or management fees1:
Residential Mortgage Loans2$2 $3 $3
Commercial and Corporate Loans 910 10
Total servicing or management fees $11 $13 $13
1 The transfer activity is related to unconsolidated VIEs.
2 Does not include GSE mortgage loan transfers