SunTrust 2013 Annual Report Download - page 107
Download and view the complete annual report
Please find page 107 of the 2013 SunTrust annual report below. You can navigate through the pages in the report by either clicking on the pages listed below, or by using the keyword search tool below to find specific information within the annual report.-
 1
1 -
2
-
3
-
4
-
5
-
6
-
7
-
8
-
9
-
10
-
11
-
12
-
13
-
14
-
15
-
16
-
17
-
18
-
19
-
20
-
21
-
22
-
23
-
24
-
25
-
26
-
27
-
28
-
29
-
30
-
31
-
32
-
33
-
34
-
35
-
36
-
37
-
38
-
39
-
40
-
41
-
42
-
43
-
44
-
45
-
46
-
47
-
48
-
49
-
50
-
51
-
52
-
53
-
54
-
55
-
56
-
57
-
58
-
59
-
60
-
61
-
62
-
63
-
64
-
65
-
66
-
67
-
68
-
69
-
70
-
71
-
72
-
73
-
74
-
75
-
76
-
77
-
78
-
79
-
80
-
81
-
82
-
83
-
84
-
85
-
86
-
87
-
88
-
89
-
90
-
91
-
92
-
93
-
94
-
95
-
96
-
 97
97 -
 98
98 -
 99
99 -
 100
100 -
 101
101 -
 102
102 -
 103
103 -
 104
104 -
 105
105 -
 106
106 -
 107
107 -
 108
108 -
 109
109 -
 110
110 -
 111
111 -
 112
112 -
 113
113 -
 114
114 -
 115
115 -
 116
116 -
 117
117 -
118
-
119
-
120
-
121
-
122
-
123
-
124
-
125
-
126
-
127
-
128
-
129
-
130
-
131
-
132
-
133
-
134
-
135
-
136
-
137
-
138
-
139
-
140
-
141
-
142
-
143
-
144
-
145
-
146
-
147
-
148
-
149
-
150
-
151
-
152
-
153
-
154
-
155
-
156
-
157
-
158
-
159
-
160
-
161
-
162
-
163
-
164
-
165
-
166
-
167
-
168
-
169
-
170
-
171
-
172
-
173
-
174
-
175
-
176
-
177
-
178
-
179
-
180
-
181
-
182
-
183
-
184
-
185
-
186
-
187
-
188
-
189
-
190
-
191
-
192
-
193
-
194
-
195
-
196
-
197
-
198
-
199
-
200
-
201
-
202
-
203
-
204
-
205
-
206
-
207
-
208
-
209
-
210
-
211
-
212
-
213
-
214
-
215
-
216
-
217
-
218
-
219
-
220
-
221
-
222
-
223
-
224
-
225
-
226
-
227
-
228
-
229
-
230
-
231
-
232
-
233
-
234
-
235
-
236
 |
 |
91
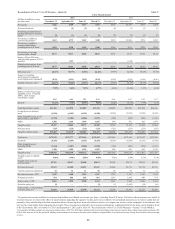
Provision for credit losses was $238 million during 2013, a decrease of $532 million, or 69%, compared to 2012. The
improvement was driven by a decline in net charge-offs, partially attributable to the $193 million in net charge-offs related
to the transfer of loans to LHFS and subsequent sale of nonperforming residential mortgage loans during 2012. Additionally,
policy changes related to second lien home equity loans and discharged Chapter 7 bankruptcy loans added $70 million in
aggregate net charge-offs during 2012.
Total noninterest income was $402 million during 2013, a decrease of $100 million, or 20%, compared to 2012. The decrease
was predominantly driven by a decline in mortgage production related income and lower mortgage servicing income, partially
offset by a decline in the mortgage repurchase provision. Mortgage production related income decreased $27 million due to
lower gain on sale margins and lower loan production, largely offset by an approximate $600 million decline in mortgage
repurchase provision. Loan originations were $29.9 billion for the year ended December 31, 2013, compared to $32.1 billion
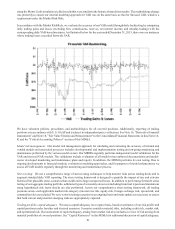
during 2012, a decrease of $2.2 billion, or 7%. Mortgage servicing income was $87 million, a decrease of $173 million, or
67%, driven by less favorable net MSR hedge performance, higher decay, and lower servicing fees due to a decline in the
servicing portfolio. Total loans serviced were $136.7 billion at December 31, 2013 compared with $144.9 billion at December
31, 2012, down 6%.
Total noninterest expense was $1.5 billion during 2013, an increase of $134 million, or 10%, compared to 2012. Operating
losses and collection services increased $234 million due to $291 million in charges to settle certain mortgage-related legal
matters and a $96 million charge related to the increase in our allowance for servicing advances. These charges were recorded
during the third quarter of 2013, compared to lower legal and servicing related losses recognized during 2012. These incremental
expenses were partially offset by declines in consulting expense of $84 million, predominantly due to lower costs associated
with the Federal Reserve Consent Order, staff expense of $33 million, credit services expense of $15 million, and other real
estate expense of $14 million. Additionally, total allocated support costs increased $51 million.
Corporate Other
Corporate Other net income during the year ended December 31, 2013 was $485 million, a decrease of $1.0 billion, or 68%,
compared to 2012. The decrease was primarily due to the securities gains as a result of the sale of our Coke stock during 2012
and lower net interest income as a result of maturing commercial loan related-swap income, partially offset by lower provision
for income taxes.
Net interest income was $309 million during 2013, a decrease of $84 million, or 21%, compared to 2012. The decrease was
driven by lower income from the aforementioned interest rate swaps and a $31 million decrease in foregone dividend income
resulting from the sale of the Coke stock in 2012. These declines were partially offset by a decrease in funding costs. Total
average assets decreased $1.8 billion, or 6%, primarily driven by a reduction in the securities AFS portfolio due to the
aforementioned sale of the Coke stock. Average long-term debt decreased $1.9 billion, or 18%, and average short-term
borrowings decreased $1.5 billion, or 27%, compared to 2012. The decline in average long-term debt was primarily due to
the repayment of senior and subordinated debt, while the decline in average short-term debt was the result of the repayment
of FHLB borrowings.
Total noninterest income was $56 million during 2013, a decrease of $1.9 billion, or 97%, compared to 2012, predominantly
due to a $1.9 billion net gain on sale of our Coke stock in 2012. This decrease was partially offset by a $69 million decline
in mark-to-market valuation losses on our public debt and index-linked CDs carried at fair value.
Total noninterest expense was a contra expense of $46 million during 2013 compared to an expense of $68 million during
2012. The decrease in expense was mainly due to a higher recovery of internal cost allocations and declines in severance
costs, incentive compensation and employee benefits related to business performance, and operating losses compared to 2012.
Additionally, 2012 expenses also included a $38 million charitable contribution of Coke stock to the SunTrust Foundation
and debt extinguishment charges related to the redemption of higher cost trust preferred securities.
The benefit for income taxes was $83 million during 2013 compared to a provision for income taxes of $767 million during
2012. The year ended December 31, 2012 included the income tax impact of the gains on the sale of the Coke stock, while
2013 included the impact of certain audit settlements, statute expirations, tax planning strategies, and/or changes in tax rates.