SunTrust 2013 Annual Report Download - page 138
Download and view the complete annual report
Please find page 138 of the 2013 SunTrust annual report below. You can navigate through the pages in the report by either clicking on the pages listed below, or by using the keyword search tool below to find specific information within the annual report.-
 1
1 -
2
-
3
-
4
-
5
-
6
-
7
-
8
-
9
-
10
-
11
-
12
-
13
-
14
-
15
-
16
-
17
-
18
-
19
-
20
-
21
-
22
-
23
-
24
-
25
-
26
-
27
-
28
-
29
-
30
-
31
-
32
-
33
-
34
-
35
-
36
-
37
-
38
-
39
-
40
-
41
-
42
-
43
-
44
-
45
-
46
-
47
-
48
-
49
-
50
-
51
-
52
-
53
-
54
-
55
-
56
-
57
-
58
-
59
-
60
-
61
-
62
-
63
-
64
-
65
-
66
-
67
-
68
-
69
-
70
-
71
-
72
-
73
-
74
-
75
-
76
-
77
-
78
-
79
-
80
-
81
-
82
-
83
-
84
-
85
-
86
-
87
-
88
-
89
-
90
-
91
-
92
-
93
-
94
-
95
-
96
-
97
-
98
-
99
-
100
-
101
-
102
-
103
-
104
-
105
-
106
-
107
-
108
-
109
-
110
-
111
-
112
-
113
-
114
-
115
-
116
-
117
-
118
-
119
-
120
-
121
-
122
-
123
-
124
-
125
-
126
-
127
-
 128
128 -
 129
129 -
 130
130 -
 131
131 -
 132
132 -
 133
133 -
 134
134 -
 135
135 -
 136
136 -
 137
137 -
 138
138 -
 139
139 -
 140
140 -
 141
141 -
 142
142 -
 143
143 -
 144
144 -
 145
145 -
 146
146 -
 147
147 -
 148
148 -
149
-
150
-
151
-
152
-
153
-
154
-
155
-
156
-
157
-
158
-
159
-
160
-
161
-
162
-
163
-
164
-
165
-
166
-
167
-
168
-
169
-
170
-
171
-
172
-
173
-
174
-
175
-
176
-
177
-
178
-
179
-
180
-
181
-
182
-
183
-
184
-
185
-
186
-
187
-
188
-
189
-
190
-
191
-
192
-
193
-
194
-
195
-
196
-
197
-
198
-
199
-
200
-
201
-
202
-
203
-
204
-
205
-
206
-
207
-
208
-
209
-
210
-
211
-
212
-
213
-
214
-
215
-
216
-
217
-
218
-
219
-
220
-
221
-
222
-
223
-
224
-
225
-
226
-
227
-
228
-
229
-
230
-
231
-
232
-
233
-
234
-
235
-
236
 |
 |

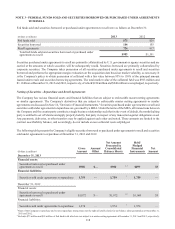
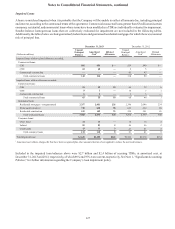
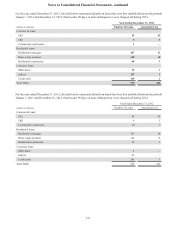
Notes to Consolidated Financial Statements, continued
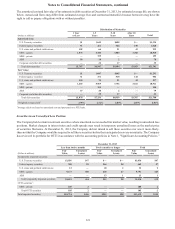
122
December 31, 2012
Less than twelve months Twelve months or longer Total
(Dollars in millions)
Fair
Value
Unrealized
Losses
Fair
Value
Unrealized
Losses
Fair
Value
Unrealized
Losses
Temporarily impaired securities:
Federal agency securities $298 $3 $— $— $298 $3
U.S. states and political subdivisions 1 — 24 5 25 5
MBS - agency 1,212 3 — — 1,212 3
ABS — — 13 2 13 2
Total temporarily impaired securities 1,511 6 37 7 1,548 13
OTTI securities1:
ABS ——3131
Total OTTI securities — — 3 1 3 1
Total impaired securities $1,511 $6 $40 $8 $1,551 $14
1Includes OTTI securities for which credit losses have been recorded in earnings in current or prior periods.
Unrealized losses on securities that have been in a temporarily impaired position for longer than twelve months included
municipal ARS, federal agency securities, agency MBS, and one ABS collateralized by 2004 vintage home equity loans. The
municipal securities are backed by investment grade rated obligors; however, the fair value of these securities continues to
be impacted by the lack of a functioning ARS market and the extension of time for expected refinance and repayment. No
credit loss is expected on these securities. The fair value of federal agency and agency MBS securities has declined due to the
increase in market interest rates. The ABS continues to receive timely principal and interest payments, and is evaluated quarterly
for credit impairment. Cash flow analysis shows that the underlying collateral can withstand highly stressed loss assumptions
without incurring a credit loss.
The portion of unrealized losses on securities that have been OTTI that relates to factors other than credit is recorded in AOCI.
Losses related to credit impairment on these securities are determined through estimated cash flow analyses and have been
recorded in earnings in current or prior periods. The unrealized OTTI loss at December 31, 2013 is related to one security
within the portfolio that is collateralized by residential mortgage loans securitized in 2007.
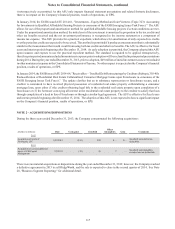
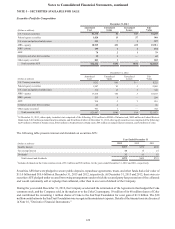
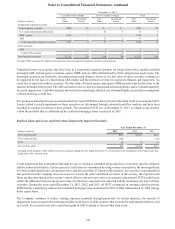
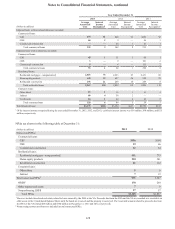
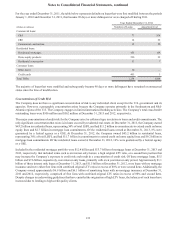
Realized Gains and Losses and Other-than-Temporarily Impaired Securities
Year Ended December 31
(Dollars in millions) 2013 2012 2011
Gross realized gains $39 $1,981 1$210
Gross realized losses (36) — (87)
OTTI (1) (7) (6)
Net securities gains $2 $1,974 $117
1 Included in this amount is $305 million in losses recognized during the year ended December 31, 2012 related to the termination of the Agreements that
hedged the Coke common stock.
Credit impairment that is determined through the use of models is estimated using cash flows on security specific collateral
and the transaction structure. Future expected credit losses are determined by using various assumptions, the most significant
of which include default rates, prepayment rates, and loss severities. If, based on this analysis, the security is in an unrealized
loss position and the Company does not expect to recover the entire amortized cost basis of the security, the expected cash
flows are then discounted at the security’s initial effective interest rate to arrive at a present value amount. OTTI credit losses
reflect the difference between the present value of cash flows expected to be collected and the amortized cost basis of these
securities. During the years ended December 31, 2013, 2012, and 2011, all OTTI recognized in earnings related to private
MBS that have underlying collateral of residential mortgage loans securitized in 2007 or ABS collateralized by 2004 vintage
home equity loans.
The Company continues to reduce existing exposure primarily through paydowns. In certain instances, the amount of
impairment losses recognized in earnings includes credit losses on debt securities that exceeds the total unrealized losses, and
as a result, the securities may have unrealized gains in AOCI relating to factors other than credit.