SunTrust 2013 Annual Report Download - page 167
Download and view the complete annual report
Please find page 167 of the 2013 SunTrust annual report below. You can navigate through the pages in the report by either clicking on the pages listed below, or by using the keyword search tool below to find specific information within the annual report.-
 1
1 -
2
-
3
-
4
-
5
-
6
-
7
-
8
-
9
-
10
-
11
-
12
-
13
-
14
-
15
-
16
-
17
-
18
-
19
-
20
-
21
-
22
-
23
-
24
-
25
-
26
-
27
-
28
-
29
-
30
-
31
-
32
-
33
-
34
-
35
-
36
-
37
-
38
-
39
-
40
-
41
-
42
-
43
-
44
-
45
-
46
-
47
-
48
-
49
-
50
-
51
-
52
-
53
-
54
-
55
-
56
-
57
-
58
-
59
-
60
-
61
-
62
-
63
-
64
-
65
-
66
-
67
-
68
-
69
-
70
-
71
-
72
-
73
-
74
-
75
-
76
-
77
-
78
-
79
-
80
-
81
-
82
-
83
-
84
-
85
-
86
-
87
-
88
-
89
-
90
-
91
-
92
-
93
-
94
-
95
-
96
-
97
-
98
-
99
-
100
-
101
-
102
-
103
-
104
-
105
-
106
-
107
-
108
-
109
-
110
-
111
-
112
-
113
-
114
-
115
-
116
-
117
-
118
-
119
-
120
-
121
-
122
-
123
-
124
-
125
-
126
-
127
-
128
-
129
-
130
-
131
-
132
-
133
-
134
-
135
-
136
-
137
-
138
-
139
-
140
-
141
-
142
-
143
-
144
-
145
-
146
-
147
-
148
-
149
-
150
-
151
-
152
-
153
-
154
-
155
-
156
-
 157
157 -
 158
158 -
 159
159 -
 160
160 -
 161
161 -
 162
162 -
 163
163 -
 164
164 -
 165
165 -
 166
166 -
 167
167 -
 168
168 -
 169
169 -
 170
170 -
 171
171 -
 172
172 -
 173
173 -
 174
174 -
 175
175 -
 176
176 -
 177
177 -
178
-
179
-
180
-
181
-
182
-
183
-
184
-
185
-
186
-
187
-
188
-
189
-
190
-
191
-
192
-
193
-
194
-
195
-
196
-
197
-
198
-
199
-
200
-
201
-
202
-
203
-
204
-
205
-
206
-
207
-
208
-
209
-
210
-
211
-
212
-
213
-
214
-
215
-
216
-
217
-
218
-
219
-
220
-
221
-
222
-
223
-
224
-
225
-
226
-
227
-
228
-
229
-
230
-
231
-
232
-
233
-
234
-
235
-
236
 |
 |

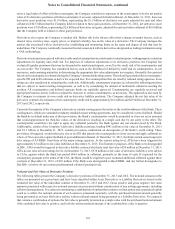
Notes to Consolidated Financial Statements, continued
151
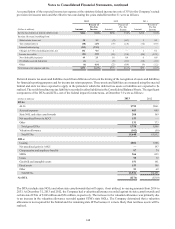
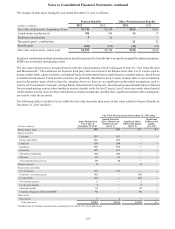
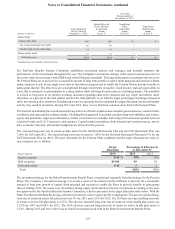
The following table presents a summary of stock option and restricted stock activity:
Stock Options Restricted Stock Restricted Stock Units
(Dollars in millions, except per
share data) Shares
Price
Range
Weighted
Average
Exercise
Price Shares
Deferred
Compensation
Weighted
Average
Grant
Price Shares
Weighted
Average
Grant
Price
Balance, January 1, 2011 17,142,500 $9.06 - 150.45 $51.17 4,620,809 $43 $25.32 65,190 $26.96
Granted 813,265 19.98 - 32.27 29.70 1,400,305 44 31.27 344,590 37.57
Exercised/vested (20,000) 9.06 9.06 (1,085,252) — 50.37 — —
Cancelled/expired/forfeited (2,066,348) 9.06 - 140.40 63.40 (313,695) (7) 22.07 (4,305) 26.96
Amortization of restricted stock
compensation — — — — (32) — — —
Balance, December 31, 2011 15,869,417 9.06 - 150.45 48.53 4,622,167 48 21.46 405,475 35.98
Granted 859,390 21.67 - 23.68 21.92 1,737,202 38 21.97 1,717,148 22.65
Exercised/vested (973,048) 9.06 - 22.69 9.90 (2,148,764) — 14.62 (109,149) 27.73
Cancelled/expired/forfeited (2,444,107) 9.06 - 85.06 45.73 (524,284) (8) 19.91 (82,828) 22.79
Amortization of restricted stock
compensation — — — — (30) — — —
Balance, December 31, 2012 13,311,652 9.06 - 150.45 50.15 3,686,321 48 25.56 1,930,646 25.16
Granted 552,998 27.41 27.41 1,314,277 39 29.58 593,093 24.65
Exercised/vested (712,981) 9.06 - 27.79 16.94 (821,636) — 25.95 (41,790) 28.73
Cancelled/expired/forfeited (2,222,298) 21.67 - 118.18 56.55 (195,424) (5) 27.41 14,229 20.54
Amortization of restricted stock
compensation — — — — (32) — — —
Balance, December 31, 2013 10,929,371 $9.06 - 150.45 $49.86 3,983,538 $50 $27.04 2,496,178 $26.69
Exercisable, December 31, 2013 9,351,182 $53.89
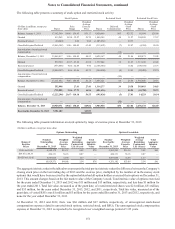
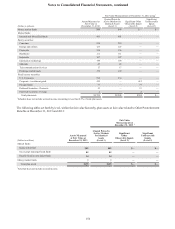
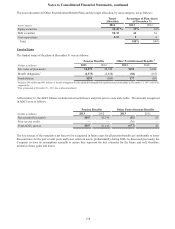
The following table presents information on stock options by range of exercise prices at December 31, 2013:
(Dollars in millions, except per share data)
Options Outstanding Options Exercisable
Range of
Exercise
Prices
Number
Outstanding
at
December 31, 2013
Weighted
Average
Exercise
Price
Weighted
Average
Remaining
Contractual
Life (Years)
Total
Aggregate
Intrinsic
Value
Number
Exercisable
at
December 31, 2013
Weighted
Average
Exercise
Price
Weighted
Average
Remaining
Contractual
Life (Years)
Total
Aggregate
Intrinsic
Value
$9.06 to 49.46 4,548,172 $19.57 6.22 $78 2,969,983 $16.14 5.22 $61
$49.47 to 64.57 424,131 56.16 0.07 — 424,131 56.16 0.07 —
$64.58 to 150.45 5,957,068 72.54 1.37 — 5,957,068 72.54 1.37 —
10,929,371 $49.86 3.34 $78 9,351,182 $53.89 2.54 $61
The aggregate intrinsic value in the table above represents the total pre-tax intrinsic value (the difference between the Company’s
closing stock price on the last trading day of 2013 and the exercise price, multiplied by the number of in-the-money stock
options) that would have been received by the option holders had all option holders exercised their options on December 31,
2013. This amount changes based on the fair market value of the Company’s stock. Total intrinsic value of options exercised
for the years ended December 31, 2013 and 2012 was $11 million and $15 million, respectively, and less than $1 million for
the year ended 2011. Total fair value, measured as of the grant date, of vested restricted shares was $21 million, $31 million,
and $55 million, for the years ended December 31, 2013, 2012, and 2011, respectively. Total fair value, measured as of the
grant date, of vested RSUs was $1 million and $3 million for the years ended December 31, 2013 and 2012, respectively, and
none for the year ended December 31, 2011.
At December 31, 2013 and 2012, there was $66 million and $67 million, respectively, of unrecognized stock-based
compensation expense related to unvested stock options, restricted stock, and RSUs. The unrecognized stock compensation
expense at December 31, 2013 is expected to be recognized over a weighted average period of 1.85 years.