SunTrust 2013 Annual Report Download - page 158
Download and view the complete annual report
Please find page 158 of the 2013 SunTrust annual report below. You can navigate through the pages in the report by either clicking on the pages listed below, or by using the keyword search tool below to find specific information within the annual report.-
 1
1 -
2
-
3
-
4
-
5
-
6
-
7
-
8
-
9
-
10
-
11
-
12
-
13
-
14
-
15
-
16
-
17
-
18
-
19
-
20
-
21
-
22
-
23
-
24
-
25
-
26
-
27
-
28
-
29
-
30
-
31
-
32
-
33
-
34
-
35
-
36
-
37
-
38
-
39
-
40
-
41
-
42
-
43
-
44
-
45
-
46
-
47
-
48
-
49
-
50
-
51
-
52
-
53
-
54
-
55
-
56
-
57
-
58
-
59
-
60
-
61
-
62
-
63
-
64
-
65
-
66
-
67
-
68
-
69
-
70
-
71
-
72
-
73
-
74
-
75
-
76
-
77
-
78
-
79
-
80
-
81
-
82
-
83
-
84
-
85
-
86
-
87
-
88
-
89
-
90
-
91
-
92
-
93
-
94
-
95
-
96
-
97
-
98
-
99
-
100
-
101
-
102
-
103
-
104
-
105
-
106
-
107
-
108
-
109
-
110
-
111
-
112
-
113
-
114
-
115
-
116
-
117
-
118
-
119
-
120
-
121
-
122
-
123
-
124
-
125
-
126
-
127
-
128
-
129
-
130
-
131
-
132
-
133
-
134
-
135
-
136
-
137
-
138
-
139
-
140
-
141
-
142
-
143
-
144
-
145
-
146
-
147
-
 148
148 -
 149
149 -
 150
150 -
 151
151 -
 152
152 -
 153
153 -
 154
154 -
 155
155 -
 156
156 -
 157
157 -
 158
158 -
 159
159 -
 160
160 -
 161
161 -
 162
162 -
 163
163 -
 164
164 -
 165
165 -
 166
166 -
 167
167 -
 168
168 -
169
-
170
-
171
-
172
-
173
-
174
-
175
-
176
-
177
-
178
-
179
-
180
-
181
-
182
-
183
-
184
-
185
-
186
-
187
-
188
-
189
-
190
-
191
-
192
-
193
-
194
-
195
-
196
-
197
-
198
-
199
-
200
-
201
-
202
-
203
-
204
-
205
-
206
-
207
-
208
-
209
-
210
-
211
-
212
-
213
-
214
-
215
-
216
-
217
-
218
-
219
-
220
-
221
-
222
-
223
-
224
-
225
-
226
-
227
-
228
-
229
-
230
-
231
-
232
-
233
-
234
-
235
-
236
 |
 |
Notes to Consolidated Financial Statements, continued
142
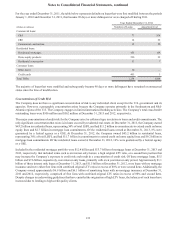
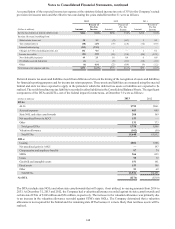
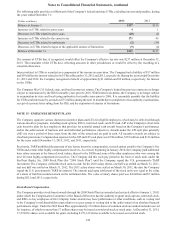
and carried at fair value. These VIEs had entered into TRS contracts with the Company with outstanding notional
amounts of $1.5 billion and $1.9 billion at December 31, 2013 and 2012, respectively, and the Company had entered
into mirror TRS contracts with third parties with the same outstanding notional amounts. At December 31, 2013, the
fair values of these TRS assets and liabilities were $35 million and $31 million, respectively, and at December 31,
2012, the fair values of these TRS assets and liabilities were $51 million and $46 million, respectively, reflecting the
pass-through nature of these structures. The notional amounts of the TRS contracts with the VIEs represent the
Company’s maximum exposure to loss, although such exposure to loss has been mitigated via the TRS contracts
with third parties. For additional information on the Company’s TRS with these VIEs, see Note 16, “Derivative
Financial Instruments.”
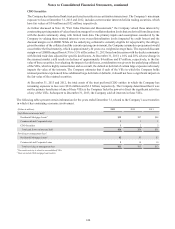
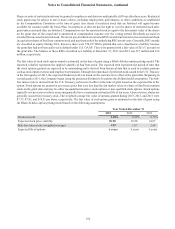
Community Development Investments
As part of its community reinvestment initiatives, the Company invests primarily within its footprint in multi-family
affordable housing developments and other community development entities as a limited and/or general partner and/
or a debt provider. The Company receives tax credits for various investments. The Company has determined that the
related partnerships are VIEs. For partnerships where the Company operates strictly as the general partner, the
Company consolidates these partnerships on its Consolidated Balance Sheets. As the general partner, the Company
typically guarantees the tax credits due to the limited partner and is responsible for funding construction and operating
deficits. At December 31, 2013 and 2012, total assets, which consist primarily of fixed assets and cash attributable
to the consolidated entities, were $3 million, and total liabilities, excluding intercompany liabilities, were $1 million.
Security deposits from the tenants are recorded as liabilities on the Company’s Consolidated Balance Sheets. The
Company maintains separate cash accounts to fund these liabilities and these assets are considered restricted. The
tenant liabilities and corresponding restricted cash assets were not material at December 31, 2013 and 2012. While
the obligations of the general partner are generally non-recourse to the Company, as the general partner, the Company
may from time to time step in when needed to fund deficits. During the years ended December 31, 2013 and 2012,
the Company did not provide any significant amount of funding as the general partner or to cover any deficits the
partnerships may have generated.
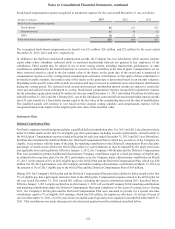
For other partnerships, the Company acts only in a limited partnership capacity. The Company has determined that
it is not the primary beneficiary of these partnerships and accounts for its interests in accordance with the accounting
guidance for investments in affordable housing projects. The general partner or an affiliate of the general partner
provides guarantees to the limited partner, which protects the Company from losses attributable to operating deficits,
construction deficits, and tax credit allocation deficits. Partnership assets of $1.5 billion and $1.2 billion in these
partnerships were not included in the Consolidated Balance Sheets at December 31, 2013 and 2012, respectively.
The limited partner interests had carrying values of $252 million and $186 million at December 31, 2013 and 2012,
respectively, and are recorded in other assets in the Company’s Consolidated Balance Sheets. The Company’s
maximum exposure to loss for these investments totaled $697 million and $505 million at December 31, 2013 and
2012, respectively. The Company’s maximum exposure to loss would be borne by the loss of the equity investments
along with $303 million and $236 million of loans, interest-rate swaps, or letters of credit issued by the Company to
the entities at December 31, 2013 and 2012, respectively. The difference between the maximum exposure to loss and
the investment and loan balances is primarily attributable to the unfunded equity commitments. Unfunded equity
commitments are amounts that the Company has committed to the entities upon the entities meeting certain conditions.
If these conditions are met, the Company will invest these additional amounts in the entities.
Additionally, the Company owns noncontrolling interests in funds whose purpose is to invest in community
developments. At December 31, 2013 and 2012, the Company's investment in these funds totaled $138 million and
$63 million, respectively, and the Company's maximum exposure to loss on its equity investments, which is comprised
of its investments in the funds plus any additional unfunded equity commitments, was $217 million and $110 million,
respectively.
When the Company owns both the limited partner and general partner interests or acts as the indemnifying party, the
Company consolidates the entities. At December 31, 2013 and 2012, total assets, which consist primarily of fixed
assets and cash, attributable to the consolidated non-VIE partnerships were $151 million and $239 million,
respectively, and total liabilities, excluding intercompany liabilities, primarily representing third party borrowings,
were $58 million and $100 million, respectively.