SunTrust 2013 Annual Report Download - page 111
Download and view the complete annual report
Please find page 111 of the 2013 SunTrust annual report below. You can navigate through the pages in the report by either clicking on the pages listed below, or by using the keyword search tool below to find specific information within the annual report.
95
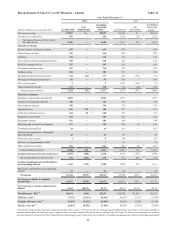
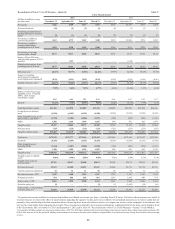
Reconcilement of Non-U.S. GAAP Measures - Annual Table 36
Year Ended December 31
(Dollars in millions, except per share data)
2013 2012
As Reported
8-K
Adjustments
Excluding
Form 8-K
items 1As Reported
8-K
Adjustments
Excluding
Form 8-K
items 1
Net interest income $4,853 $— $4,853 $5,102 $— $5,102
Provision for credit losses 553 — 553 1,395 172 21,223
Net interest income after provision
for credit losses 4,300 — 4,300 3,707 172 3,879
Noninterest Income
Service charges on deposit accounts 657 — 657 676 — 676
Other charges and fees 369 — 369 402 — 402
Card fees 310 — 310 316 — 316
Trust and investment management income 518 — 518 512 — 512
Retail investment services 267 — 267 241 — 241
Investment banking income 356 — 356 342 — 342
Trading income 182 — 182 211 — 211
Mortgage production related income 314 (63) 3377 343 (371) 4714
Mortgage servicing related income 87 — 87 260 — 260
Net securities gains 2— 2 1,974 1,938 536
Other noninterest income 152 — 152 96 (92) 6188
Total noninterest income 3,214 (63) 3,277 5,373 1,475 3,898
Noninterest Expense
Employee compensation and benefits 2,901 — 2,901 3,077 — 3,077
Outside processing and software 746 — 746 710 — 710
Net occupancy expense 348 — 348 359 — 359
Operating losses 503 323 7180 277 — 277
Credit and collection services 264 96 8168 239 — 239
Regulatory assessments 181 — 181 233 — 233
Equipment expense 181 — 181 188 — 188
Marketing and customer development 135 — 135 184 38 9146
Consulting and legal fees 73 —73 165 —165
Amortization/impairment of intangible
assets/goodwill 23 — 23 46 — 46
Other real estate expense 4— 4 140 — 140
Net loss on extinguishment of debt —— — 16 — 16
Other noninterest expense 521 — 521 689 96 10 593
Total noninterest expense 5,880 419 5,461 6,323 134 6,189
Income before provision for income taxes 1,634 (482) 2,116 2,757 1,169 1,588
Provision/(benefit) for income taxes 273 (303) 11 576 773 416 11 357
Income including income attributable to
noncontrolling interest 1,361 (179) 1,540 1,984 753 1,231
Net income attributable to noncontrolling
interest 17 — 17 26 — 26
Net income $1,344 ($179) $1,523 $1,958 $753 $1,205
Net income available to common
shareholders $1,297 ($179) $1,476 $1,931 $753 $1,178
Net income per average common share -
diluted $2.41 ($0.33) $2.74 $3.59 $1.40 $2.19
Total Revenue - FTE 12 $8,194 ($63) $8,257 $10,598 $1,475 $9,123
Efficiency ratio 13 71.75% (5.61)% 66.14% 59.67% 8.17% 67.84%
Tangible efficiency ratio 14 71.48% (5.62)% 65.86% 59.24% 8.10% 67.34%
Effective tax rate 15 16.89% 10.55% 27.44% 28.29% (5.43)% 22.86%
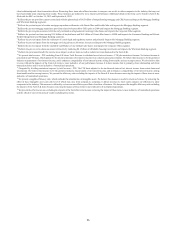
1 We present certain income statement categories and also total revenue - FTE, net income per average common diluted share, net income, net income available to
common shareholders, an efficiency ratio, a tangible efficiency ratio, and the effective tax rate, excluding Form 8-K items. We believe these measures are useful to
investors because it removes the effect of material items impacting the years' results and is more reflective of normalized operations as it reflects results that are primarily


