SunTrust 2013 Annual Report Download - page 148
Download and view the complete annual report
Please find page 148 of the 2013 SunTrust annual report below. You can navigate through the pages in the report by either clicking on the pages listed below, or by using the keyword search tool below to find specific information within the annual report.-
 1
1 -
2
-
3
-
4
-
5
-
6
-
7
-
8
-
9
-
10
-
11
-
12
-
13
-
14
-
15
-
16
-
17
-
18
-
19
-
20
-
21
-
22
-
23
-
24
-
25
-
26
-
27
-
28
-
29
-
30
-
31
-
32
-
33
-
34
-
35
-
36
-
37
-
38
-
39
-
40
-
41
-
42
-
43
-
44
-
45
-
46
-
47
-
48
-
49
-
50
-
51
-
52
-
53
-
54
-
55
-
56
-
57
-
58
-
59
-
60
-
61
-
62
-
63
-
64
-
65
-
66
-
67
-
68
-
69
-
70
-
71
-
72
-
73
-
74
-
75
-
76
-
77
-
78
-
79
-
80
-
81
-
82
-
83
-
84
-
85
-
86
-
87
-
88
-
89
-
90
-
91
-
92
-
93
-
94
-
95
-
96
-
97
-
98
-
99
-
100
-
101
-
102
-
103
-
104
-
105
-
106
-
107
-
108
-
109
-
110
-
111
-
112
-
113
-
114
-
115
-
116
-
117
-
118
-
119
-
120
-
121
-
122
-
123
-
124
-
125
-
126
-
127
-
128
-
129
-
130
-
131
-
132
-
133
-
134
-
135
-
136
-
137
-
 138
138 -
 139
139 -
 140
140 -
 141
141 -
 142
142 -
 143
143 -
 144
144 -
 145
145 -
 146
146 -
 147
147 -
 148
148 -
 149
149 -
 150
150 -
 151
151 -
 152
152 -
 153
153 -
 154
154 -
 155
155 -
 156
156 -
 157
157 -
 158
158 -
159
-
160
-
161
-
162
-
163
-
164
-
165
-
166
-
167
-
168
-
169
-
170
-
171
-
172
-
173
-
174
-
175
-
176
-
177
-
178
-
179
-
180
-
181
-
182
-
183
-
184
-
185
-
186
-
187
-
188
-
189
-
190
-
191
-
192
-
193
-
194
-
195
-
196
-
197
-
198
-
199
-
200
-
201
-
202
-
203
-
204
-
205
-
206
-
207
-
208
-
209
-
210
-
211
-
212
-
213
-
214
-
215
-
216
-
217
-
218
-
219
-
220
-
221
-
222
-
223
-
224
-
225
-
226
-
227
-
228
-
229
-
230
-
231
-
232
-
233
-
234
-
235
-
236
 |
 |
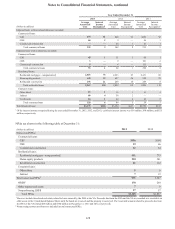
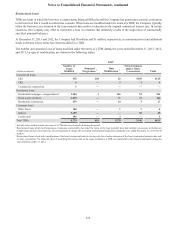
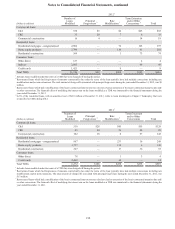
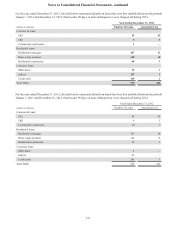
Notes to Consolidated Financial Statements, continued
132
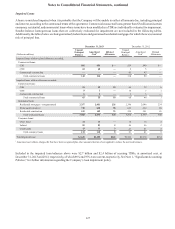
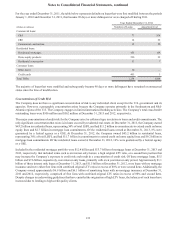
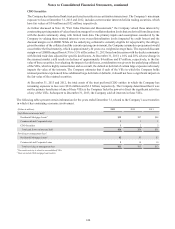
For the year ended December 31, 2011, the table below represents defaults on loans that were first modified between the periods
January 1, 2010 and December 31, 2011, that became 90 days or more delinquent or were charged-off during 2011.
Year Ended December 31, 2011
(Dollars in millions) Number of Loans Amortized Cost
Commercial loans:
C&I 71 $14
CRE 14 22
Commercial construction 32 28
Residential loans:
Residential mortgages 455 108
Home equity products 220 22
Residential construction 33 7
Consumer loans:
Other direct 10 —
Credit cards 403 3
Total TDRs 1,238 $204
The majority of loans that were modified and subsequently became 90 days or more delinquent have remained on nonaccrual
status since the time of modification.
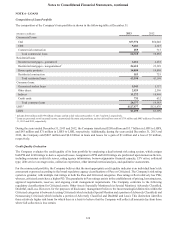
Concentrations of Credit Risk
The Company does not have a significant concentration of risk to any individual client except for the U.S. government and its
agencies. However, a geographic concentration arises because the Company operates primarily in the Southeastern and Mid-
Atlantic regions of the U.S. The Company engages in limited international banking activities. The Company’s total cross-border
outstanding loans were $956 million and $562 million at December 31, 2013 and 2012, respectively.
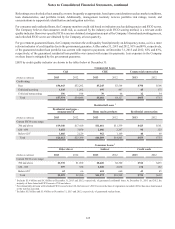
The major concentrations of credit risk for the Company arise by collateral type in relation to loans and credit commitments. The
only significant concentration that exists is in loans secured by residential real estate. At December 31, 2013, the Company owned
$43.2 billion in residential loans, representing 34% of total LHFI, and had $11.2 billion in commitments to extend credit on home
equity lines and $2.7 billion in mortgage loan commitments. Of the residential loans owned at December 31, 2013, 8% were
guaranteed by a federal agency or a GSE. At December 31, 2012, the Company owned $43.2 billion in residential loans,
representing 36% of total LHFI, and had $11.7 billion in commitments to extend credit on home equity lines and $9.2 billion in
mortgage loan commitments. Of the residential loans owned at December 31, 2012, 10% were guaranteed by a federal agency
or a GSE.
Included in the residential mortgage portfolio were $12.4 billion and $13.7 billion of mortgage loans at December 31, 2013 and
2012, respectively, that included terms such as an interest only feature, a high original LTV ratio, or a second lien position that
may increase the Company’s exposure to credit risk and result in a concentration of credit risk. Of these mortgage loans, $5.5
billion and $7.6 billion, respectively, were interest only loans, primarily with a ten year interest only period. Approximately $1.1
billion of those interest only loans at December 31, 2013, and $1.5 billion at December 31, 2012, were loans with no mortgage
insurance and were either first liens with combined original LTV ratios in excess of 80% or were second liens. Additionally, the
Company owned approximately $6.9 billion and $6.1 billion of amortizing loans with no mortgage insurance at December 31,
2013 and 2012, respectively, comprised of first liens with combined original LTV ratios in excess of 80% and second liens.
Despite changes in underwriting guidelines that have curtailed the origination of high LTV loans, the balances of such loans have
increased due to lending to high credit quality clients.