SunTrust 2013 Annual Report Download - page 153
Download and view the complete annual report
Please find page 153 of the 2013 SunTrust annual report below. You can navigate through the pages in the report by either clicking on the pages listed below, or by using the keyword search tool below to find specific information within the annual report.-
 1
1 -
2
-
3
-
4
-
5
-
6
-
7
-
8
-
9
-
10
-
11
-
12
-
13
-
14
-
15
-
16
-
17
-
18
-
19
-
20
-
21
-
22
-
23
-
24
-
25
-
26
-
27
-
28
-
29
-
30
-
31
-
32
-
33
-
34
-
35
-
36
-
37
-
38
-
39
-
40
-
41
-
42
-
43
-
44
-
45
-
46
-
47
-
48
-
49
-
50
-
51
-
52
-
53
-
54
-
55
-
56
-
57
-
58
-
59
-
60
-
61
-
62
-
63
-
64
-
65
-
66
-
67
-
68
-
69
-
70
-
71
-
72
-
73
-
74
-
75
-
76
-
77
-
78
-
79
-
80
-
81
-
82
-
83
-
84
-
85
-
86
-
87
-
88
-
89
-
90
-
91
-
92
-
93
-
94
-
95
-
96
-
97
-
98
-
99
-
100
-
101
-
102
-
103
-
104
-
105
-
106
-
107
-
108
-
109
-
110
-
111
-
112
-
113
-
114
-
115
-
116
-
117
-
118
-
119
-
120
-
121
-
122
-
123
-
124
-
125
-
126
-
127
-
128
-
129
-
130
-
131
-
132
-
133
-
134
-
135
-
136
-
137
-
138
-
139
-
140
-
141
-
142
-
 143
143 -
 144
144 -
 145
145 -
 146
146 -
 147
147 -
 148
148 -
 149
149 -
 150
150 -
 151
151 -
 152
152 -
 153
153 -
 154
154 -
 155
155 -
 156
156 -
 157
157 -
 158
158 -
 159
159 -
 160
160 -
 161
161 -
 162
162 -
 163
163 -
164
-
165
-
166
-
167
-
168
-
169
-
170
-
171
-
172
-
173
-
174
-
175
-
176
-
177
-
178
-
179
-
180
-
181
-
182
-
183
-
184
-
185
-
186
-
187
-
188
-
189
-
190
-
191
-
192
-
193
-
194
-
195
-
196
-
197
-
198
-
199
-
200
-
201
-
202
-
203
-
204
-
205
-
206
-
207
-
208
-
209
-
210
-
211
-
212
-
213
-
214
-
215
-
216
-
217
-
218
-
219
-
220
-
221
-
222
-
223
-
224
-
225
-
226
-
227
-
228
-
229
-
230
-
231
-
232
-
233
-
234
-
235
-
236
 |
 |

Notes to Consolidated Financial Statements, continued
137
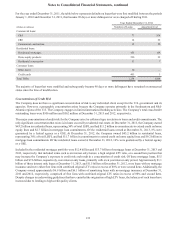
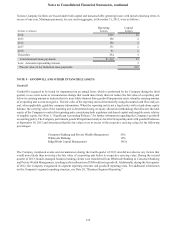
The estimated future amortization expense for intangible assets is as follows:
(Dollars in millions)
Core Deposit
Intangibles Other Total
2014 $4 $7 $11
2015 —55
2016 —22
2017 —22
2018 —22
Thereafter — 3 3
Total 1$4 $21 $25
1 Estimated future amortization expense is less than the intangible asset balance at December 31, 2013, due to the anticipated sale of RidgeWorth, including
its intangible assets, in 2014. See additional discussion of the planned sale in Note 20, “Business Segment Reporting.”
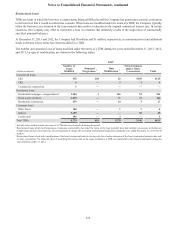
Mortgage Servicing Rights
The Company retains MSRs from certain of its sales or securitizations of residential mortgage loans. MSRs on residential
mortgage loans are the only servicing assets capitalized by the Company and are classified within intangible assets on the
Company's Consolidated Balance Sheets.
Income earned by the Company on its MSRs is derived primarily from contractually specified mortgage servicing fees and
late fees, net of curtailment costs. Such income earned for the years ended December 31, 2013, 2012, and 2011 was $317
million, $333 million, and $364 million, respectively. These amounts are reported in mortgage servicing related income in
the Consolidated Statements of Income.
At December 31, 2013 and 2012, the total UPB of mortgage loans serviced was $136.7 billion and $144.9 billion, respectively.
Included in these amounts were $106.8 billion and $113.2 billion at December 31, 2013 and 2012, respectively, of loans
serviced for third parties. During the years ended December 31, 2013 and 2012, the Company sold MSRs, at a price
approximating their fair value, on residential loans with a UPB of $2.8 billion and $2.1 billion, respectively.
At the end of each quarter, the Company determines the fair value of the MSRs using a valuation model that calculates the
present value of the estimated future net servicing income. The model incorporates a number of assumptions as MSRs do not
trade in an active and open market with readily observable prices. The Company determines fair value using market based
prepayment rates, discount rates, and other assumptions that are compared to various sources of market data including
independent third party valuations and industry surveys. Senior management and the STM valuation committee review all
significant assumptions quarterly since many factors can affect the fair value of MSRs. Changes to the valuation model inputs
and assumptions are reflected in the periods' results.
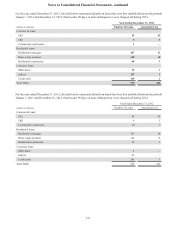
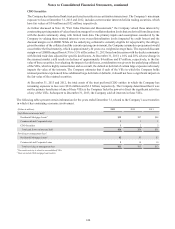
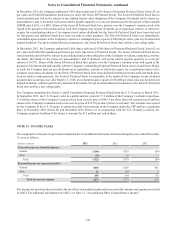
A summary of the key characteristics, inputs, and economic assumptions used to estimate the fair value of the Company’s
MSRs at December 31, 2013 and 2012, and the sensitivity of the fair values to immediate 10% and 20% adverse changes in
those assumptions are shown in the table below. The overall change in MSRs during the year ended December 31, 2013 was
primarily due to originations and an increase in prevailing interest rates during the period.
(Dollars in millions) December 31, 2013 December 31, 2012
Fair value of retained MSRs $1,300 $899
Prepayment rate assumption (annual) 8% 16%
Decline in fair value from 10% adverse change $38 $50
Decline in fair value from 20% adverse change 74 95
Discount rate (annual) 12% 11%
Decline in fair value from 10% adverse change $66 $37
Decline in fair value from 20% adverse change 126 70
Weighted-average life (in years) 7.7 4.9
Weighted-average coupon 4.4% 4.8%
The above sensitivities are hypothetical and should be used with caution. As the amounts indicate, changes in fair value based
on variations in assumptions generally cannot be extrapolated because the relationship of the change in assumption to the
change in fair value may not be linear. Also, in this table, the effect of a variation in a particular assumption on the fair value
of the retained interest is calculated without changing any other assumption. In reality, changes in one factor may result in