SunTrust 2013 Annual Report Download - page 53
Download and view the complete annual report
Please find page 53 of the 2013 SunTrust annual report below. You can navigate through the pages in the report by either clicking on the pages listed below, or by using the keyword search tool below to find specific information within the annual report.-
 1
1 -
2
-
3
-
4
-
5
-
6
-
7
-
8
-
9
-
10
-
11
-
12
-
13
-
14
-
15
-
16
-
17
-
18
-
19
-
20
-
21
-
22
-
23
-
24
-
25
-
26
-
27
-
28
-
29
-
30
-
31
-
32
-
33
-
34
-
35
-
36
-
37
-
38
-
39
-
40
-
41
-
42
-
 43
43 -
 44
44 -
 45
45 -
 46
46 -
 47
47 -
 48
48 -
 49
49 -
 50
50 -
 51
51 -
 52
52 -
 53
53 -
 54
54 -
 55
55 -
 56
56 -
 57
57 -
 58
58 -
 59
59 -
 60
60 -
 61
61 -
 62
62 -
 63
63 -
64
-
65
-
66
-
67
-
68
-
69
-
70
-
71
-
72
-
73
-
74
-
75
-
76
-
77
-
78
-
79
-
80
-
81
-
82
-
83
-
84
-
85
-
86
-
87
-
88
-
89
-
90
-
91
-
92
-
93
-
94
-
95
-
96
-
97
-
98
-
99
-
100
-
101
-
102
-
103
-
104
-
105
-
106
-
107
-
108
-
109
-
110
-
111
-
112
-
113
-
114
-
115
-
116
-
117
-
118
-
119
-
120
-
121
-
122
-
123
-
124
-
125
-
126
-
127
-
128
-
129
-
130
-
131
-
132
-
133
-
134
-
135
-
136
-
137
-
138
-
139
-
140
-
141
-
142
-
143
-
144
-
145
-
146
-
147
-
148
-
149
-
150
-
151
-
152
-
153
-
154
-
155
-
156
-
157
-
158
-
159
-
160
-
161
-
162
-
163
-
164
-
165
-
166
-
167
-
168
-
169
-
170
-
171
-
172
-
173
-
174
-
175
-
176
-
177
-
178
-
179
-
180
-
181
-
182
-
183
-
184
-
185
-
186
-
187
-
188
-
189
-
190
-
191
-
192
-
193
-
194
-
195
-
196
-
197
-
198
-
199
-
200
-
201
-
202
-
203
-
204
-
205
-
206
-
207
-
208
-
209
-
210
-
211
-
212
-
213
-
214
-
215
-
216
-
217
-
218
-
219
-
220
-
221
-
222
-
223
-
224
-
225
-
226
-
227
-
228
-
229
-
230
-
231
-
232
-
233
-
234
-
235
-
236
 |
 |
37
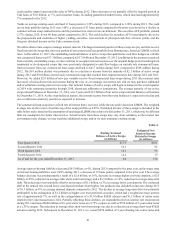
commercial deposits resulted in a 15 basis point reduction in interest-bearing deposit costs during 2013 compared to 2012. See
additional discussions in the "Net Interest Income/Margin" and "Deposits" sections of this MD&A.
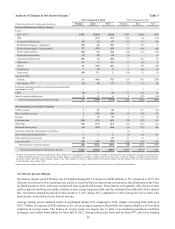
Total revenue, on an FTE basis, decreased 23% in 2013 compared to 2012, and when excluding the impact from the Form 8-K
items, decreased 9% compared to 2012. The decrease was due to lower net interest income and mortgage-related income, partially
offset by higher wealth management and capital markets revenue. The decrease in net interest income was due to relatively stable
average earning assets and a 31 basis point decline in rates earned on those assets. The decrease in mortgage-related income was
primarily due to a decline in production volume, the compression of gain on sale margins, and a decline in net MSR hedge
performance, all driven by the increase in market interest rates during 2013. See Table 36, "Reconcilement of Non-U.S. GAAP
Measures - Annual," for a reconciliation of revenue, excluding Form 8-K items.
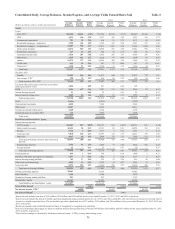
Net interest income, on an FTE basis, decreased 5% during 2013 compared to 2012, due to a decrease in our commercial loan
swap-related income and the continued low interest rate environment contributing to lower earning asset yields, partially offset
by favorable shifts in the deposit mix, lower deposit rates, and the reduction in average long-term debt. The prior year also included
$31 million of dividends on Coke shares that we sold in 2012. Our net interest margin was 3.24% during 2013 compared to 3.40%
during 2012. The decline in net interest margin was due to the same factors as noted in the decline in net interest income. In 2014,
we expect the net interest margin to decline compared to 2013, but at a lower rate relative to the decline we experienced this year.
The driver of this decline is anticipated to be further compression in loan yields due to the continued low short-term interest rate
environment. We expect improvements in net interest income in 2014, assuming that the loan growth we experienced at the end
of 2013 continues. See additional discussion related to net interest margin in the "Net Interest Income/Margin," section of this
MD&A.
Noninterest income decreased 40% during 2013 compared to 2012, and decreased 16% when excluding the impact from the Form
8-K items. The decrease was driven by a decline in mortgage-related revenue as a result of a decline in production volume, lower
gain on sale margins, and a decline in net MSR hedge performance, all attributable to the increase in market interest rates during
2013. Partially offsetting the decrease was higher wealth management and capital markets revenue, as well as a decline in the
mortgage repurchase provision and mark-to-market valuation losses on our fair value debt and index-linked CDs during 2013
compared to 2012. See Table 36, "Reconcilement of Non-U.S. GAAP Measures - Annual," for a reconciliation of noninterest
income, excluding Form 8-K items.
Noninterest expense decreased 7% during 2013 compared to 2012, and decreased 12%, when excluding the impact from the Form
8-K items, and was driven by efficiency improvements that caused a decline in most expense categories, as well as the abatement
of cyclically high credit-related expenses and reduced legal and consulting expenses. A significant driver of the lower noninterest
expense was a 6% decline in compensation and benefits expense due in large part to the decline in full time equivalent employees
which resulted in a decrease in salaries and other benefits costs. A significant driver of the decline in credit-related costs was the
97% decrease in other real estate expense compared to 2012 due to increased gains on sales of owned properties, while operating
expenses and loss provisioning related to owned properties decreased. Consulting and legal expenses declined due to the completion
of certain mortgage regulatory-related projects. Additionally, operating losses declined 35%, excluding Form 8-K items, due
predominantly to lower mortgage and regulatory legal-related expenses. See Table 36, "Reconcilement of Non-U.S. GAAP
Measures - Annual," for a reconciliation of noninterest expense and related components, excluding Form 8-K items.
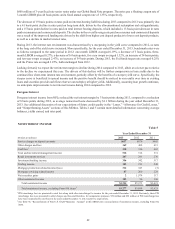
Business segments highlights
Net income improved 88% in Consumer Banking and Private Wealth Management during 2013 compared to 2012, driven by credit
quality and expense improvements. Reductions in the provision for credit losses and noninterest expense offset lower revenue to
drive the substantial increase in net income. Revenue was moderately lower during 2013 compared to 2012, driven by the sale of
$2.2 billion of government-guaranteed student loans in 2012, partially offset by an 8% increase in consumer loan production during
2013 due to solid organic loan growth and a 5% increase in wealth management-related revenues. An improvement in credit quality
drove a 44% decrease in the provision for credit losses during 2013 compared to 2012. The improvement was predominantly
driven by our home equity portfolio as a result of the strengthening housing market, as well as an increase in the provision in the
prior year due to a change in our credit policy related to the charge-off of junior lien loans and reclassification to nonaccrual of
certain Chapter 7 bankruptcy loans. The 9% reduction in noninterest expenses during 2013 was primarily driven by changes to
our branch staffing model and retail branch network due to clients increasingly utilizing self-service channels. Our retail branch
network decreased 7% in 2013 from December 31, 2012, due to our efforts to better align our branch network and staffing levels
in response to evolving client preferences. We expect further declines in our branch network in 2014; however, the overall rate of
decline will be slower when compared to 2013. The decrease in expenses drove the 458 and 362 basis point improvements in 2013
in our efficiency and tangible efficiency ratios, respectively, compared to 2012.