SunTrust 2013 Annual Report Download - page 47
Download and view the complete annual report
Please find page 47 of the 2013 SunTrust annual report below. You can navigate through the pages in the report by either clicking on the pages listed below, or by using the keyword search tool below to find specific information within the annual report.-
 1
1 -
2
-
3
-
4
-
5
-
6
-
7
-
8
-
9
-
10
-
11
-
12
-
13
-
14
-
15
-
16
-
17
-
18
-
19
-
20
-
21
-
22
-
23
-
24
-
25
-
26
-
27
-
28
-
29
-
30
-
31
-
32
-
33
-
34
-
35
-
36
-
 37
37 -
 38
38 -
 39
39 -
 40
40 -
 41
41 -
 42
42 -
 43
43 -
 44
44 -
 45
45 -
 46
46 -
 47
47 -
 48
48 -
 49
49 -
 50
50 -
 51
51 -
 52
52 -
 53
53 -
 54
54 -
 55
55 -
 56
56 -
 57
57 -
58
-
59
-
60
-
61
-
62
-
63
-
64
-
65
-
66
-
67
-
68
-
69
-
70
-
71
-
72
-
73
-
74
-
75
-
76
-
77
-
78
-
79
-
80
-
81
-
82
-
83
-
84
-
85
-
86
-
87
-
88
-
89
-
90
-
91
-
92
-
93
-
94
-
95
-
96
-
97
-
98
-
99
-
100
-
101
-
102
-
103
-
104
-
105
-
106
-
107
-
108
-
109
-
110
-
111
-
112
-
113
-
114
-
115
-
116
-
117
-
118
-
119
-
120
-
121
-
122
-
123
-
124
-
125
-
126
-
127
-
128
-
129
-
130
-
131
-
132
-
133
-
134
-
135
-
136
-
137
-
138
-
139
-
140
-
141
-
142
-
143
-
144
-
145
-
146
-
147
-
148
-
149
-
150
-
151
-
152
-
153
-
154
-
155
-
156
-
157
-
158
-
159
-
160
-
161
-
162
-
163
-
164
-
165
-
166
-
167
-
168
-
169
-
170
-
171
-
172
-
173
-
174
-
175
-
176
-
177
-
178
-
179
-
180
-
181
-
182
-
183
-
184
-
185
-
186
-
187
-
188
-
189
-
190
-
191
-
192
-
193
-
194
-
195
-
196
-
197
-
198
-
199
-
200
-
201
-
202
-
203
-
204
-
205
-
206
-
207
-
208
-
209
-
210
-
211
-
212
-
213
-
214
-
215
-
216
-
217
-
218
-
219
-
220
-
221
-
222
-
223
-
224
-
225
-
226
-
227
-
228
-
229
-
230
-
231
-
232
-
233
-
234
-
235
-
236
 |
 |

31
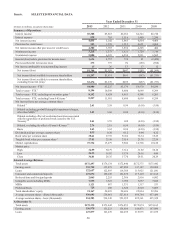
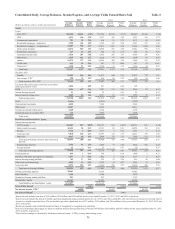
ALLL 2,044 2,174 2,457 2,974 3,120
Consumer and commercial deposits 127,735 130,180 125,611 120,025 116,303
Brokered time and foreign deposits 2,024 2,136 2,311 3,019 5,560
Long-term debt 10,700 9,357 10,908 13,648 17,490
Total shareholders’ equity 21,422 20,985 20,066 23,130 22,531
Financial Ratios
ROA 0.78% 1.11% 0.38% 0.11% (0.89)%
ROE 6.34 9.56 2.56 (0.49) (10.07)
ROTCE19.25 14.02 3.83 (0.76) (17.56)
Net interest margin - FTE 3.24 3.40 3.50 3.38 3.04
Efficiency ratio 71.75 59.67 72.49 67.94 79.07
Tangible efficiency ratio 171.48 59.24 71.99 67.36 69.35
Tangible efficiency ratio, excluding Form 8-K items 165.86 67.34 71.99 67.36 69.35
Total average shareholders’ equity to total average assets 12.27 11.64 12.00 13.25 12.70
Tangible equity to tangible assets 19.00 8.82 8.10 10.12 9.66
Effective tax rate/(benefit) 16.89 28.29 10.84 NM3(36.50)
Allowance to year-end total loans 1.60 1.80 2.01 2.58 2.76
Total NPAs to total loans plus OREO, other repossessed assets,
and nonperforming LHFS 0.91 1.52 2.76 4.08 5.33
Common dividend payout ratio 414.5 5.6 12.9 N/A N/A
Capital adequacy at period end
Tier 1 common equity 9.82% 10.04% 9.22% 8.08% 7.67%
Tier 1 capital 10.81 11.13 10.90 13.67 12.96
Total capital 12.81 13.48 13.67 16.54 16.43
Tier 1 leverage 9.58 8.91 8.75 10.94 10.90
1 See Non-GAAP reconcilements in Table 36 of the MD&A.
2 For EPS calculation purposes, the impact of dilutive securities are excluded from the diluted share count during periods in which we recognize a net loss available
to common shareholders because the impact would be antidilutive.
3 The calculated effective tax rate was not meaningful.
4 The common dividend payout ratio is not applicable in a period of net loss.