SunTrust 2013 Annual Report Download - page 193
Download and view the complete annual report
Please find page 193 of the 2013 SunTrust annual report below. You can navigate through the pages in the report by either clicking on the pages listed below, or by using the keyword search tool below to find specific information within the annual report.-
 1
1 -
2
-
3
-
4
-
5
-
6
-
7
-
8
-
9
-
10
-
11
-
12
-
13
-
14
-
15
-
16
-
17
-
18
-
19
-
20
-
21
-
22
-
23
-
24
-
25
-
26
-
27
-
28
-
29
-
30
-
31
-
32
-
33
-
34
-
35
-
36
-
37
-
38
-
39
-
40
-
41
-
42
-
43
-
44
-
45
-
46
-
47
-
48
-
49
-
50
-
51
-
52
-
53
-
54
-
55
-
56
-
57
-
58
-
59
-
60
-
61
-
62
-
63
-
64
-
65
-
66
-
67
-
68
-
69
-
70
-
71
-
72
-
73
-
74
-
75
-
76
-
77
-
78
-
79
-
80
-
81
-
82
-
83
-
84
-
85
-
86
-
87
-
88
-
89
-
90
-
91
-
92
-
93
-
94
-
95
-
96
-
97
-
98
-
99
-
100
-
101
-
102
-
103
-
104
-
105
-
106
-
107
-
108
-
109
-
110
-
111
-
112
-
113
-
114
-
115
-
116
-
117
-
118
-
119
-
120
-
121
-
122
-
123
-
124
-
125
-
126
-
127
-
128
-
129
-
130
-
131
-
132
-
133
-
134
-
135
-
136
-
137
-
138
-
139
-
140
-
141
-
142
-
143
-
144
-
145
-
146
-
147
-
148
-
149
-
150
-
151
-
152
-
153
-
154
-
155
-
156
-
157
-
158
-
159
-
160
-
161
-
162
-
163
-
164
-
165
-
166
-
167
-
168
-
169
-
170
-
171
-
172
-
173
-
174
-
175
-
176
-
177
-
178
-
179
-
180
-
181
-
182
-
 183
183 -
 184
184 -
 185
185 -
 186
186 -
 187
187 -
 188
188 -
 189
189 -
 190
190 -
 191
191 -
 192
192 -
 193
193 -
 194
194 -
 195
195 -
 196
196 -
 197
197 -
 198
198 -
 199
199 -
 200
200 -
 201
201 -
 202
202 -
 203
203 -
204
-
205
-
206
-
207
-
208
-
209
-
210
-
211
-
212
-
213
-
214
-
215
-
216
-
217
-
218
-
219
-
220
-
221
-
222
-
223
-
224
-
225
-
226
-
227
-
228
-
229
-
230
-
231
-
232
-
233
-
234
-
235
-
236
 |
 |

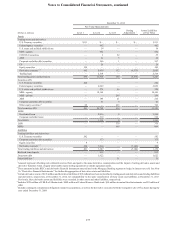
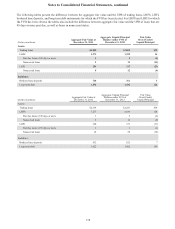
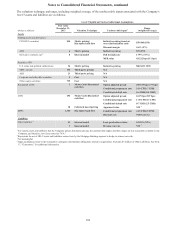
Notes to Consolidated Financial Statements, continued
177
December 31, 2012
Fair Value Measurements
(Dollars in millions) Level 1 Level 2 Level 3
Netting
Adjustments 1Assets/Liabilities
at Fair Value
Assets
Trading assets and derivatives:
U.S. Treasury securities $111 $— $— $— $111
Federal agency securities — 462 — — 462
U.S. states and political subdivisions — 34 — — 34
MBS - agency — 432 — — 432
CDO/CLO securities — 3 52 — 55
ABS — 31 5 — 36
Corporate and other debt securities — 566 1 — 567
CP —28— — 28
Equity securities 100 — — — 100
Derivative contracts 2, 3 485 8,039 132 (6,573) 2,083
Trading loans — 2,319 — — 2,319
Total trading assets and derivatives 696 11,914 190 (6,573) 6,227
Securities AFS:
U.S. Treasury securities 222 — — — 222
Federal agency securities — 2,069 — — 2,069
U.S. states and political subdivisions — 274 46 — 320
MBS - agency — 18,169 — — 18,169
MBS - private — — 209 — 209
ABS — 195 21 — 216
Corporate and other debt securities — 41 5 — 46
Other equity securities 469 — 633 — 702
Total securities AFS 291 20,748 914 — 21,953
LHFS:
Residential loans — 2,916 8 — 2,924
Corporate and other loans — 319 — — 319
Total LHFS — 3,235 8 — 3,243
LHFI — — 379 — 379
MSRs — — 899 — 899
Liabilities
Trading liabilities and derivatives:
U.S. Treasury securities 582 — — — 582
Corporate and other debt securities — 173 — — 173
Equity securities 9 — — — 9
Derivative contracts 2, 3 300 7,214 — (7,102) 412
Total trading liabilities and derivatives 891 7,387 — (7,102) 1,176
Brokered time deposits — 832 — — 832
Long-term debt — 1,622 — — 1,622
Other liabilities 5——31 — 31
1 Amounts represent offsetting cash collateral received from and paid to the same derivative counterparties and the impact of netting derivative assets and
derivative liabilities when a legally enforceable master netting agreement or similar agreement exists.
2 These amounts include IRLCs and derivative financial instruments entered into by the Mortgage Banking segment to hedge its interest rate risk. See Note
16, "Derivative Financial Instruments," for further disaggregation of derivative assets and liabilities.
3 Certain derivative assets of $178 million and derivative liabilities of $15 million have been reclassified to trading assets and derivatives and trading liabilities
and derivatives, respectively, at December 31, 2012, for comparability to the same classification of these assets and liabilities at December 31, 2013.
Previously, these derivative assets and liabilities were recorded in other assets and other liabilities, respectively.
4 Includes $229 million of FHLB of Atlanta stock, $402 million of Federal Reserve Bank stock, $69 million in mutual fund investments, and $2 million of
other.
5 Includes contingent consideration obligations related to acquisitions, as well as the derivative associated with the Company's sale of Visa shares during the
year ended December 31, 2009.