SunTrust 2013 Annual Report Download - page 64
Download and view the complete annual report
Please find page 64 of the 2013 SunTrust annual report below. You can navigate through the pages in the report by either clicking on the pages listed below, or by using the keyword search tool below to find specific information within the annual report.-
 1
1 -
2
-
3
-
4
-
5
-
6
-
7
-
8
-
9
-
10
-
11
-
12
-
13
-
14
-
15
-
16
-
17
-
18
-
19
-
20
-
21
-
22
-
23
-
24
-
25
-
26
-
27
-
28
-
29
-
30
-
31
-
32
-
33
-
34
-
35
-
36
-
37
-
38
-
39
-
40
-
41
-
42
-
43
-
44
-
45
-
46
-
47
-
48
-
49
-
50
-
51
-
52
-
53
-
 54
54 -
 55
55 -
 56
56 -
 57
57 -
 58
58 -
 59
59 -
 60
60 -
 61
61 -
 62
62 -
 63
63 -
 64
64 -
 65
65 -
 66
66 -
 67
67 -
 68
68 -
 69
69 -
 70
70 -
 71
71 -
 72
72 -
 73
73 -
 74
74 -
75
-
76
-
77
-
78
-
79
-
80
-
81
-
82
-
83
-
84
-
85
-
86
-
87
-
88
-
89
-
90
-
91
-
92
-
93
-
94
-
95
-
96
-
97
-
98
-
99
-
100
-
101
-
102
-
103
-
104
-
105
-
106
-
107
-
108
-
109
-
110
-
111
-
112
-
113
-
114
-
115
-
116
-
117
-
118
-
119
-
120
-
121
-
122
-
123
-
124
-
125
-
126
-
127
-
128
-
129
-
130
-
131
-
132
-
133
-
134
-
135
-
136
-
137
-
138
-
139
-
140
-
141
-
142
-
143
-
144
-
145
-
146
-
147
-
148
-
149
-
150
-
151
-
152
-
153
-
154
-
155
-
156
-
157
-
158
-
159
-
160
-
161
-
162
-
163
-
164
-
165
-
166
-
167
-
168
-
169
-
170
-
171
-
172
-
173
-
174
-
175
-
176
-
177
-
178
-
179
-
180
-
181
-
182
-
183
-
184
-
185
-
186
-
187
-
188
-
189
-
190
-
191
-
192
-
193
-
194
-
195
-
196
-
197
-
198
-
199
-
200
-
201
-
202
-
203
-
204
-
205
-
206
-
207
-
208
-
209
-
210
-
211
-
212
-
213
-
214
-
215
-
216
-
217
-
218
-
219
-
220
-
221
-
222
-
223
-
224
-
225
-
226
-
227
-
228
-
229
-
230
-
231
-
232
-
233
-
234
-
235
-
236
 |
 |

48
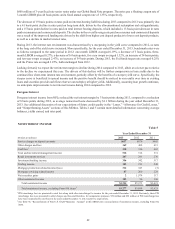
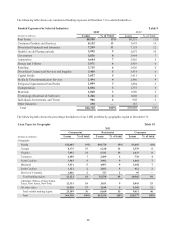
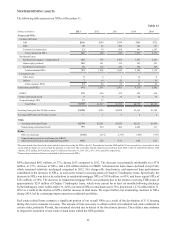
The following table shows our commercial lending exposure at December 31 to selected industries:
Funded Exposures by Selected Industries Table 9
2013 2012
(Dollars in millions) Loans % of Total Loans % of Total
Real Estate $8,500 13% $6,331 11%
Consumer Products and Services 8,152 13 7,693 13
Diversified Financials and Insurance 7,249 11 7,155 12
Health Care & Pharmaceuticals 5,995 9 5,875 10
Government 5,036 8 3,964 7
Automotive 4,604 7 3,816 6
Energy and Utilities 3,971 6 3,419 6
Retailing 3,715 6 3,626 6
Diversified Commercial Services and Supplies 3,460 5 3,414 6
Capital Goods 3,057 5 3,411 6
Media & Telecommunication Services 2,494 4 2,466 4
Religious Organizations/Non-Profits 1,899 3 1,884 3
Transportation 1,896 3 1,737 3
Materials 1,860 3 1,960 3
Technology (Hardware & Software) 1,226 2 1,068 2
Individuals, Investments, and Trusts 906 2 902 2
Other Industries 290 — 167 —
Total $64,310 100% $58,888 100%
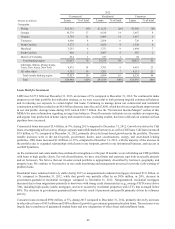
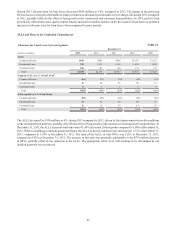
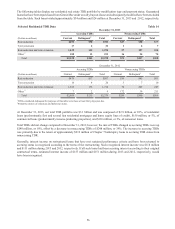
The following table shows the percentage breakdown of our LHFI portfolio by geographic region at December 31:
Loan Types by Geography Table 10
2013
Commercial Residential Consumer
(Dollars in millions) Loans % of total Loans % of total Loans % of total
Geography:
Florida $12,003 19% $10,770 25% $3,683 18%
Georgia 8,175 13 6,210 14 1,539 8
Virginia 7,052 11 6,312 15 1,633 8
Tennessee 4,689 7 2,489 6 738 4
North Carolina 3,583 5 3,902 9 1,464 7
Maryland 3,431 5 4,097 9 1,402 7
South Carolina 1,122 2 2,023 5 412 2
District of Columbia 1,066 2 727 2 95 —
Total banking region 41,121 64 36,530 85 10,966 54
California, Illinois, Pennsylvania,
Texas, New Jersey, New York 12,131 19 3,811 9 5,043 25
All other states 11,058 17 2,849 6 4,368 21
Total outside banking region 23,189 36 6,660 15 9,411 46
Total $64,310 100% $43,190 100% $20,377 100%