SunTrust 2013 Annual Report Download - page 216
Download and view the complete annual report
Please find page 216 of the 2013 SunTrust annual report below. You can navigate through the pages in the report by either clicking on the pages listed below, or by using the keyword search tool below to find specific information within the annual report.-
 1
1 -
2
-
3
-
4
-
5
-
6
-
7
-
8
-
9
-
10
-
11
-
12
-
13
-
14
-
15
-
16
-
17
-
18
-
19
-
20
-
21
-
22
-
23
-
24
-
25
-
26
-
27
-
28
-
29
-
30
-
31
-
32
-
33
-
34
-
35
-
36
-
37
-
38
-
39
-
40
-
41
-
42
-
43
-
44
-
45
-
46
-
47
-
48
-
49
-
50
-
51
-
52
-
53
-
54
-
55
-
56
-
57
-
58
-
59
-
60
-
61
-
62
-
63
-
64
-
65
-
66
-
67
-
68
-
69
-
70
-
71
-
72
-
73
-
74
-
75
-
76
-
77
-
78
-
79
-
80
-
81
-
82
-
83
-
84
-
85
-
86
-
87
-
88
-
89
-
90
-
91
-
92
-
93
-
94
-
95
-
96
-
97
-
98
-
99
-
100
-
101
-
102
-
103
-
104
-
105
-
106
-
107
-
108
-
109
-
110
-
111
-
112
-
113
-
114
-
115
-
116
-
117
-
118
-
119
-
120
-
121
-
122
-
123
-
124
-
125
-
126
-
127
-
128
-
129
-
130
-
131
-
132
-
133
-
134
-
135
-
136
-
137
-
138
-
139
-
140
-
141
-
142
-
143
-
144
-
145
-
146
-
147
-
148
-
149
-
150
-
151
-
152
-
153
-
154
-
155
-
156
-
157
-
158
-
159
-
160
-
161
-
162
-
163
-
164
-
165
-
166
-
167
-
168
-
169
-
170
-
171
-
172
-
173
-
174
-
175
-
176
-
177
-
178
-
179
-
180
-
181
-
182
-
183
-
184
-
185
-
186
-
187
-
188
-
189
-
190
-
191
-
192
-
193
-
194
-
195
-
196
-
197
-
198
-
199
-
200
-
201
-
202
-
203
-
204
-
205
-
 206
206 -
 207
207 -
 208
208 -
 209
209 -
 210
210 -
 211
211 -
 212
212 -
 213
213 -
 214
214 -
 215
215 -
 216
216 -
 217
217 -
 218
218 -
 219
219 -
 220
220 -
 221
221 -
 222
222 -
 223
223 -
 224
224 -
 225
225 -
 226
226 -
227
-
228
-
229
-
230
-
231
-
232
-
233
-
234
-
235
-
236
 |
 |
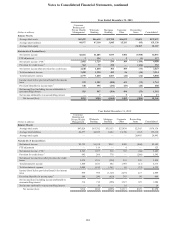
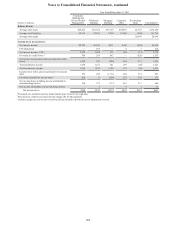
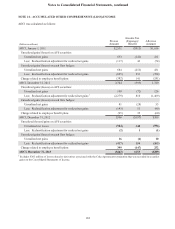
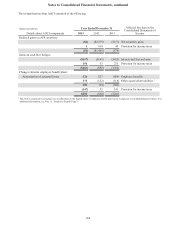
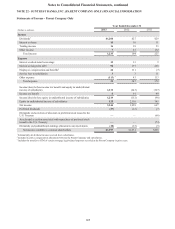
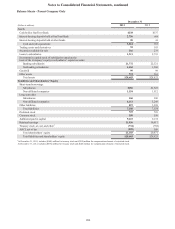
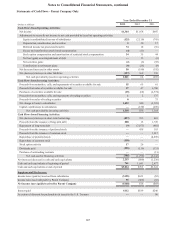
Notes to Consolidated Financial Statements, continued
200
For business segment reporting purposes, the basis of presentation in the accompanying discussion includes the following:
• Net interest income – Net interest income is presented on a FTE basis to make tax-exempt assets comparable to
other taxable products. The segments have also been matched maturity funds transfer priced, generating credits or
charges based on the economic value or cost created by the assets and liabilities of each segment. The mismatch
between funds credits and funds charges at the segment level resides in Reconciling Items. The change in the
matched maturity funds mismatch is generally attributable to corporate balance sheet management strategies.
• Provision for credit losses – Represents net charge-offs by segment. The difference between the segment's total
net charge-offs and the consolidated provision for credit losses is reported in Reconciling Items.
• Provision/(benefit) for income taxes – Calculated using a blended income tax rate for each segment. This
calculation includes the impact of various income adjustments, such as the reversal of the FTE gross up on tax-
exempt assets, tax adjustments, and credits that are unique to each segment. The difference between the calculated
provision/(benefit) for income taxes at the segment level and the consolidated provision/(benefit) for income taxes
is reported in Reconciling Items.
The segment’s financial performance is comprised of direct financial results, as well as various allocations that for internal
management reporting purposes provide an enhanced view of analyzing the segment’s financial performance. The internal
allocations include the following:
• Operational Costs – Expenses are charged to the segments based on various statistical volumes multiplied by
activity based cost rates. As a result of the activity based costing process, planned residual expenses are also
allocated to the segments. The recoveries for the majority of these costs are in Corporate Other.
• Support and Overhead Costs – Expenses not directly attributable to a specific segment are allocated based on
various drivers (e.g., number of full-time equivalent employees and volume of loans and deposits). The recoveries
for these allocations are in Corporate Other.
• Sales and Referral Credits – Segments may compensate another segment for referring or selling certain products.
The majority of the revenue resides in the segment where the product is ultimately managed.
The application and development of management reporting methodologies is a dynamic process and is subject to periodic
enhancements. The implementation of these enhancements to the internal management reporting methodology may materially
affect the results disclosed for each segment with no impact on consolidated results. Whenever significant changes to
management reporting methodologies take place, the impact of these changes is quantified and prior period information is
reclassified wherever practicable. Prior year results have been restated to reflect the 2013 transfer of branch-managed business
banking clients from Wholesale Banking to Consumer Banking and Private Wealth Management.