SunTrust 2013 Annual Report Download - page 206
Download and view the complete annual report
Please find page 206 of the 2013 SunTrust annual report below. You can navigate through the pages in the report by either clicking on the pages listed below, or by using the keyword search tool below to find specific information within the annual report.-
 1
1 -
2
-
3
-
4
-
5
-
6
-
7
-
8
-
9
-
10
-
11
-
12
-
13
-
14
-
15
-
16
-
17
-
18
-
19
-
20
-
21
-
22
-
23
-
24
-
25
-
26
-
27
-
28
-
29
-
30
-
31
-
32
-
33
-
34
-
35
-
36
-
37
-
38
-
39
-
40
-
41
-
42
-
43
-
44
-
45
-
46
-
47
-
48
-
49
-
50
-
51
-
52
-
53
-
54
-
55
-
56
-
57
-
58
-
59
-
60
-
61
-
62
-
63
-
64
-
65
-
66
-
67
-
68
-
69
-
70
-
71
-
72
-
73
-
74
-
75
-
76
-
77
-
78
-
79
-
80
-
81
-
82
-
83
-
84
-
85
-
86
-
87
-
88
-
89
-
90
-
91
-
92
-
93
-
94
-
95
-
96
-
97
-
98
-
99
-
100
-
101
-
102
-
103
-
104
-
105
-
106
-
107
-
108
-
109
-
110
-
111
-
112
-
113
-
114
-
115
-
116
-
117
-
118
-
119
-
120
-
121
-
122
-
123
-
124
-
125
-
126
-
127
-
128
-
129
-
130
-
131
-
132
-
133
-
134
-
135
-
136
-
137
-
138
-
139
-
140
-
141
-
142
-
143
-
144
-
145
-
146
-
147
-
148
-
149
-
150
-
151
-
152
-
153
-
154
-
155
-
156
-
157
-
158
-
159
-
160
-
161
-
162
-
163
-
164
-
165
-
166
-
167
-
168
-
169
-
170
-
171
-
172
-
173
-
174
-
175
-
176
-
177
-
178
-
179
-
180
-
181
-
182
-
183
-
184
-
185
-
186
-
187
-
188
-
189
-
190
-
191
-
192
-
193
-
194
-
195
-
 196
196 -
 197
197 -
 198
198 -
 199
199 -
 200
200 -
 201
201 -
 202
202 -
 203
203 -
 204
204 -
 205
205 -
 206
206 -
 207
207 -
 208
208 -
 209
209 -
 210
210 -
 211
211 -
 212
212 -
 213
213 -
 214
214 -
 215
215 -
 216
216 -
217
-
218
-
219
-
220
-
221
-
222
-
223
-
224
-
225
-
226
-
227
-
228
-
229
-
230
-
231
-
232
-
233
-
234
-
235
-
236
 |
 |
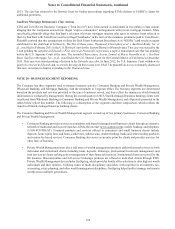
Notes to Consolidated Financial Statements, continued
190
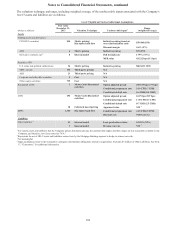
Non-recurring Fair Value Measurements
The following tables present those assets measured at fair value on a non-recurring basis at December 31, 2013 and 2012,
respectively, as well as loans for which impairment has been recognized during the years ended December 31, 2013 and 2012.
The changes in fair value when comparing balances at December 31, 2013 to those at December 31, 2012, generally result
from the application of LOCOM or through write-downs of individual assets. The table does not reflect the change in fair
value attributable to any related economic hedges the Company may have used to mitigate the interest rate risk associated
with LHFS and MSRs.
(Dollars in millions) December 31, 2013
Quoted Prices in
Active Markets
for Identical
Assets/Liabilities
(Level 1)
Significant
Other
Observable
Inputs
(Level 2)
Significant
Unobservable
Inputs
(Level 3)
Losses for the
Year Ended
December 31,
2013
LHFS $278 $— $278 $— ($3)
LHFI 75 — — 75 —
OREO 49 — 1 48 (10)
Affordable Housing 7 — — 7 (3)
Other Assets 171 — 158 13 (61)
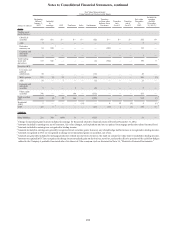
(Dollars in millions) December 31, 2012
Quoted Prices in
Active Markets
for Identical
Assets/Liabilities
(Level 1)
Significant
Other
Observable
Inputs
(Level 2)
Significant
Unobservable
Inputs
(Level 3)
Losses for the
Year Ended
December 31,
2012
LHFS $65 $— $65 $— $—
LHFI 308 — — 308 (79)
OREO 264 — 205 59 (48)
Affordable Housing 82 — — 82 (96)
Other Assets 65 — 42 23 (13)
The following is a discussion of the valuation techniques and inputs used in developing fair value measurements for assets
classified as level 2 or 3 that are measured at fair value on a non-recurring basis, as determined by the nature and risks of the
instrument.
Loans Held for Sale
At December 31, 2013 and 2012, level 2 LHFS consisted primarily of agency and non-agency residential mortgages, which
were measured using observable collateral valuations, and corporate loans that are accounted for at LOCOM. These loans
were valued consistent with the methodology discussed in the Recurring Fair Value Measurement section of this footnote.
During 2013, the Company transferred $25 million of residential mortgage NPLs to LHFS, as the Company elected to actively
market these loans for sale. These loans were predominantly reported at amortized cost prior to transferring to LHFS; however,
a portion of the NPLs was carried at fair value. As a result of transferring the loans to LHFS, the Company recognized a $3
million charge-off to reflect the loans' estimated market value. These transferred NPL loans were sold at approximately their
carrying value during 2013. The Company also sold an additional $63 million of residential mortgage NPLs which had either
been transferred to LHFS in a prior period or repurchased into LHFS directly. These additional loans were sold at a gain of
approximately $12 million.
During 2012, the Company transferred $700 million of residential mortgage NPLs to LHFS, as the Company elected to actively
market these loans for sale. These loans were predominantly reported at amortized cost prior to transferring to LHFS; however,
a portion of the NPLs was carried at fair value. As a result of transferring the loans to LHFS, the Company recognized a $199
million charge-off to reflect the loans' estimated market value. Of these transferred loans, $486 million were sold at
approximately their carrying value during the year, $6 million remained in LHFS, $7 million were returned to LHFI as they
were no longer deemed marketable for sale, and $2 million were removed as a result of various loss mitigation events.
Loans Held for Investment
At December 31, 2013, LHFI consisted primarily of consumer and residential real estate loans discharged in Chapter 7
bankruptcy that had not been reaffirmed by the borrower, as well as nonperforming CRE loans for which specific reserves
have been recognized. As these loans have been classified as nonperforming, cash proceeds from the sale of the underlying
collateral is the expected source of repayment for a majority of these loans. Accordingly, the fair value of these loans is derived