SunTrust 2013 Annual Report Download - page 75
Download and view the complete annual report
Please find page 75 of the 2013 SunTrust annual report below. You can navigate through the pages in the report by either clicking on the pages listed below, or by using the keyword search tool below to find specific information within the annual report.-
 1
1 -
2
-
3
-
4
-
5
-
6
-
7
-
8
-
9
-
10
-
11
-
12
-
13
-
14
-
15
-
16
-
17
-
18
-
19
-
20
-
21
-
22
-
23
-
24
-
25
-
26
-
27
-
28
-
29
-
30
-
31
-
32
-
33
-
34
-
35
-
36
-
37
-
38
-
39
-
40
-
41
-
42
-
43
-
44
-
45
-
46
-
47
-
48
-
49
-
50
-
51
-
52
-
53
-
54
-
55
-
56
-
57
-
58
-
59
-
60
-
61
-
62
-
63
-
64
-
 65
65 -
 66
66 -
 67
67 -
 68
68 -
 69
69 -
 70
70 -
 71
71 -
 72
72 -
 73
73 -
 74
74 -
 75
75 -
 76
76 -
 77
77 -
 78
78 -
 79
79 -
 80
80 -
 81
81 -
 82
82 -
 83
83 -
 84
84 -
 85
85 -
86
-
87
-
88
-
89
-
90
-
91
-
92
-
93
-
94
-
95
-
96
-
97
-
98
-
99
-
100
-
101
-
102
-
103
-
104
-
105
-
106
-
107
-
108
-
109
-
110
-
111
-
112
-
113
-
114
-
115
-
116
-
117
-
118
-
119
-
120
-
121
-
122
-
123
-
124
-
125
-
126
-
127
-
128
-
129
-
130
-
131
-
132
-
133
-
134
-
135
-
136
-
137
-
138
-
139
-
140
-
141
-
142
-
143
-
144
-
145
-
146
-
147
-
148
-
149
-
150
-
151
-
152
-
153
-
154
-
155
-
156
-
157
-
158
-
159
-
160
-
161
-
162
-
163
-
164
-
165
-
166
-
167
-
168
-
169
-
170
-
171
-
172
-
173
-
174
-
175
-
176
-
177
-
178
-
179
-
180
-
181
-
182
-
183
-
184
-
185
-
186
-
187
-
188
-
189
-
190
-
191
-
192
-
193
-
194
-
195
-
196
-
197
-
198
-
199
-
200
-
201
-
202
-
203
-
204
-
205
-
206
-
207
-
208
-
209
-
210
-
211
-
212
-
213
-
214
-
215
-
216
-
217
-
218
-
219
-
220
-
221
-
222
-
223
-
224
-
225
-
226
-
227
-
228
-
229
-
230
-
231
-
232
-
233
-
234
-
235
-
236
 |
 |
59
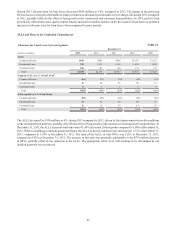
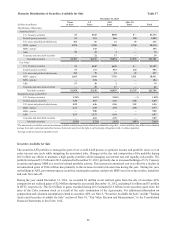
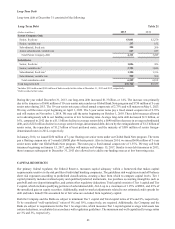
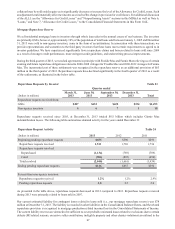
Maturity Distribution of Securities Available for Sale Table 17
December 31, 2013
(Dollars in millions)
1 Year
or Less
1-5
Years
5-10
Years
After 10
Years Total
Distribution of Maturities:
Amortized Cost1:
U.S. Treasury securities $1 $645 $688 $— $1,334
Federal agency securities 51 261 566 150 1,028
U.S. states and political subdivisions 102 66 21 43 232
MBS - agency 1,575 5,780 7,800 3,760 18,915
MBS - private — 155 — — 155
ABS 58 18 2 — 78
Corporate and other debt securities —2217—39
Total debt securities $1,787 $6,947 $9,094 $3,953 $21,781
Fair Value1:
U.S. Treasury securities $1 $647 $645 $— $1,293
Federal agency securities 51 271 518 144 984
U.S. states and political subdivisions 104 70 21 42 237
MBS - agency 1,665 5,969 7,756 3,521 18,911
MBS - private — 154 — — 154
ABS 57 20 2 — 79
Corporate and other debt securities —2517—42
Total debt securities $1,878 $7,156 $8,959 $3,707 $21,700
Weighted average yield (FTE)2:
U.S. Treasury securities 1.24% 1.62% 2.06% —% 1.85%
Federal agency securities 3.30 3.07 2.41 2.86 2.69
U.S. states and political subdivisions 5.89 6.26 5.26 3.52 5.50
MBS - agency 2.76 2.58 2.92 2.84 2.79
MBS - private — 9.00 — — 9.00
ABS 2.53 11.77 9.01 — 4.87
Corporate and other debt securities — 4.81 2.70 — 3.89
Total debt securities 2.95% 2.72% 2.83% 2.85% 2.81%
1The amortized cost and fair value of investments in debt securities are presented based on estimated average life. Actual cash flows may differ from estimated
average lives and contractual maturities because borrowers may have the right to call or prepay obligations with or without penalties.
2Average yields are based on amortized cost.
Securities Available for Sale
The securities AFS portfolio is managed as part of our overall ALM process to optimize income and portfolio value over an
entire interest rate cycle while mitigating the associated risks. Changes in the size and composition of the portfolio during
2013 reflect our efforts to maintain a high quality portfolio while managing our interest rate and liquidity risk profile. The
portfolio increased $1.5 billion in 2013 compared to December 31, 2012, primarily due to increased holdings of U.S. Treasury
securities and agency MBS as a result of normal portfolio activity. This increase in amortized cost was offset by a decline in
net unrealized gains of $946 million due primarily to the increase in market interest rates during the year. During the year,
our holdings in ABS, government agency securities, municipal securities, and private MBS were lower due to sales, maturities
and cash flow run-off.
During the year ended December 31, 2013, we recorded $2 million in net realized gains from the sale of securities AFS,
compared to net realized gains of $2.0 billion during the year ended December 31, 2012, including $1 million and $7 million
in OTTI, respectively. The $2.0 billion in gains recorded during 2012 included $1.9 billion in net securities gains from the
sales of the Coke common stock as a result of the early termination of the Agreements. For additional information on
composition and valuation assumptions related to securities AFS, see Note 5, "Securities Available for Sale," and the “Trading
Assets and Securities Available for Sale” section of Note 18, “Fair Value Election and Measurement,” to the Consolidated
Financial Statements in this Form 10-K.