SunTrust 2013 Annual Report Download - page 57
Download and view the complete annual report
Please find page 57 of the 2013 SunTrust annual report below. You can navigate through the pages in the report by either clicking on the pages listed below, or by using the keyword search tool below to find specific information within the annual report.-
 1
1 -
2
-
3
-
4
-
5
-
6
-
7
-
8
-
9
-
10
-
11
-
12
-
13
-
14
-
15
-
16
-
17
-
18
-
19
-
20
-
21
-
22
-
23
-
24
-
25
-
26
-
27
-
28
-
29
-
30
-
31
-
32
-
33
-
34
-
35
-
36
-
37
-
38
-
39
-
40
-
41
-
42
-
43
-
44
-
45
-
46
-
 47
47 -
 48
48 -
 49
49 -
 50
50 -
 51
51 -
 52
52 -
 53
53 -
 54
54 -
 55
55 -
 56
56 -
 57
57 -
 58
58 -
 59
59 -
 60
60 -
 61
61 -
 62
62 -
 63
63 -
 64
64 -
 65
65 -
 66
66 -
 67
67 -
68
-
69
-
70
-
71
-
72
-
73
-
74
-
75
-
76
-
77
-
78
-
79
-
80
-
81
-
82
-
83
-
84
-
85
-
86
-
87
-
88
-
89
-
90
-
91
-
92
-
93
-
94
-
95
-
96
-
97
-
98
-
99
-
100
-
101
-
102
-
103
-
104
-
105
-
106
-
107
-
108
-
109
-
110
-
111
-
112
-
113
-
114
-
115
-
116
-
117
-
118
-
119
-
120
-
121
-
122
-
123
-
124
-
125
-
126
-
127
-
128
-
129
-
130
-
131
-
132
-
133
-
134
-
135
-
136
-
137
-
138
-
139
-
140
-
141
-
142
-
143
-
144
-
145
-
146
-
147
-
148
-
149
-
150
-
151
-
152
-
153
-
154
-
155
-
156
-
157
-
158
-
159
-
160
-
161
-
162
-
163
-
164
-
165
-
166
-
167
-
168
-
169
-
170
-
171
-
172
-
173
-
174
-
175
-
176
-
177
-
178
-
179
-
180
-
181
-
182
-
183
-
184
-
185
-
186
-
187
-
188
-
189
-
190
-
191
-
192
-
193
-
194
-
195
-
196
-
197
-
198
-
199
-
200
-
201
-
202
-
203
-
204
-
205
-
206
-
207
-
208
-
209
-
210
-
211
-
212
-
213
-
214
-
215
-
216
-
217
-
218
-
219
-
220
-
221
-
222
-
223
-
224
-
225
-
226
-
227
-
228
-
229
-
230
-
231
-
232
-
233
-
234
-
235
-
236
 |
 |

41
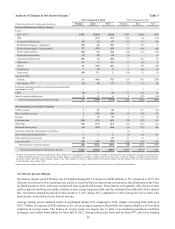
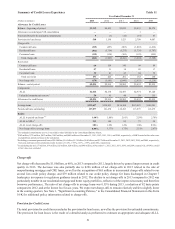
credit quality improvement and the sales of NPLs during 2012. These decreases were partially offset by targeted growth in
C&I loans of $3.6 billion, or 7%, and consumer loans, excluding guaranteed student loans, which increased approximately
7% compared to the 2012.
Yields on average earning assets declined 31 basis points to 3.59% during 2013, compared to 3.90% during 2012. The yield
on our loan portfolio during 2013 was 3.88%, a decrease of 31 basis points compared to the prior year driven by a decline in
commercial loan swap-related income and the persistent low interest rate environment. The securities AFS portfolio yielded
2.57% during 2013, down 40 basis points compared to 2012. The yield decline for securities AFS was primarily driven by
the prepayments and maturities of higher yielding securities, reinvestment of principal cash flow at lower yields, and the
foregone dividend income on the Coke common stock.
We utilize interest rate swaps to manage interest rate risk. The largest notional position of these swaps are pay variable-receive
fixed interest rate swaps that convert a portion of our commercial loan portfolio from floating rates, based on LIBOR, to fixed
rates. At December 31, 2013, the outstanding notional balance of active swaps that qualified as cash flow hedges on variable
rate commercial loans was $17.3 billion, compared to $17.4 billion at December 31, 2012. In addition to the income recognized
from currently outstanding swaps, we also continue to recognize interest income over the original hedge period resulting from
terminated or de-designated swaps that were previously designated as cash flow hedges on variable rate commercial loans.
Interest income from our commercial loan swaps declined to $417 million during 2013 compared to $508 million during
2012. The $91 million decline was primarily due to a decline in income from the maturity of $2.1 billion of active swaps
during 2013 and $9.0 billion of previously terminated swaps that reached their original maturity date during 2012 and 2013.
However, we added $2.0 billion of new pay variable-receive fixed commercial loan swaps during 2013 after interest rates
increased, which aided net interest income during the year. As we manage our interest rate risk we may purchase additional
and/or terminate existing interest rate swaps. Our notional balance of active swaps will begin to mature in the second quarter
of 2014 with remaining maturities through 2018, absent any additions or terminations. The average maturity of our active
swap notional balances at December 31, 2013, was 2 years and $12.5 billion of our active swap notional balances will mature
by December 31, 2016. As the swap balances mature, the interest income from the swap balances is expected to decline and
our overall asset sensitivity position is expected to increase.
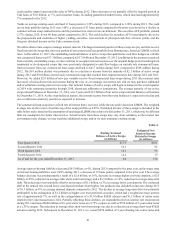
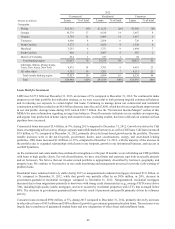
The commercial loan swaps have a fixed rate of interest that is received, while the rate paid is based on LIBOR. The weighted
average rate on the receive fixed rate leg of the swap portfolio is 2.05%. Estimated income of these swaps is included in the
table below and is based on the assumption of unchanged LIBOR rates relative to December 31, 2013, which may be different
than our assumption for future interest rates. Actual income from these swaps may vary from estimates, as the interest rate
environment may change, we may purchase additional swaps, and/or we may terminate existing swaps.
Table 4
Ending Notional
Balance of Active Swaps
(in billions)
Estimated Net
Interest Income
Related to Swaps
(in millions)
First Quarter 2014 $17.3 $101
Second Quarter 2014 16.1 98
Third Quarter 2014 16.1 93
Fourth Quarter 2014 12.6 79
As of and for the year ended December 31, 2015 6.6 134
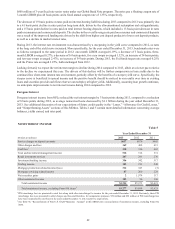
Average interest-bearing liabilities decreased $4.5 billion, or 4%, during 2013 compared to the prior year, and average rates
on interest-bearing liabilities were 0.49% during 2013, a decrease of 19 basis points compared to the prior year. The average
balance decrease was predominantly a result of a $2.6 billion, or 16%, decrease in average higher-cost time deposits, a $2.0
billion, or 29%, reduction in average other short-term borrowings, and a $1.9 billion, or 16%, reduction in average long-term
debt. These decreases were partially offset by an increase of $2.1 billion, or 3%, in average lower cost deposits. The continued
shift in the deposit mix toward lower cost deposit products from higher cost products also included an increase during 2013
of $1.3 billion, or 4%, in average demand deposits compared to 2012. The decline in average long-term debt was primarily
attributable to the redemption of $1.2 billion of higher cost trust preferred securities, which had a weighted average interest
rate of approximately 7%, as well as the extinguishment of a $1.0 billion FHLB advance and $1.2 billion of senior notes
related to the Coke transaction in 2012. Partially offsetting these declines, we responded to the low interest rate environment
during 2013 and issued $600 million of 10-year senior notes at a 2.75% coupon, as well as $750 million of 5-year senior notes
at a 2.35% coupon. The reduction in average other short-term borrowings was due to a reduction in average short-term FHLB
advances during 2013. Subsequent to December 31, 2013, we issued $250 million of 3-year floating rate senior notes and