SunTrust 2013 Annual Report Download - page 183
Download and view the complete annual report
Please find page 183 of the 2013 SunTrust annual report below. You can navigate through the pages in the report by either clicking on the pages listed below, or by using the keyword search tool below to find specific information within the annual report.-
 1
1 -
2
-
3
-
4
-
5
-
6
-
7
-
8
-
9
-
10
-
11
-
12
-
13
-
14
-
15
-
16
-
17
-
18
-
19
-
20
-
21
-
22
-
23
-
24
-
25
-
26
-
27
-
28
-
29
-
30
-
31
-
32
-
33
-
34
-
35
-
36
-
37
-
38
-
39
-
40
-
41
-
42
-
43
-
44
-
45
-
46
-
47
-
48
-
49
-
50
-
51
-
52
-
53
-
54
-
55
-
56
-
57
-
58
-
59
-
60
-
61
-
62
-
63
-
64
-
65
-
66
-
67
-
68
-
69
-
70
-
71
-
72
-
73
-
74
-
75
-
76
-
77
-
78
-
79
-
80
-
81
-
82
-
83
-
84
-
85
-
86
-
87
-
88
-
89
-
90
-
91
-
92
-
93
-
94
-
95
-
96
-
97
-
98
-
99
-
100
-
101
-
102
-
103
-
104
-
105
-
106
-
107
-
108
-
109
-
110
-
111
-
112
-
113
-
114
-
115
-
116
-
117
-
118
-
119
-
120
-
121
-
122
-
123
-
124
-
125
-
126
-
127
-
128
-
129
-
130
-
131
-
132
-
133
-
134
-
135
-
136
-
137
-
138
-
139
-
140
-
141
-
142
-
143
-
144
-
145
-
146
-
147
-
148
-
149
-
150
-
151
-
152
-
153
-
154
-
155
-
156
-
157
-
158
-
159
-
160
-
161
-
162
-
163
-
164
-
165
-
166
-
167
-
168
-
169
-
170
-
171
-
172
-
 173
173 -
 174
174 -
 175
175 -
 176
176 -
 177
177 -
 178
178 -
 179
179 -
 180
180 -
 181
181 -
 182
182 -
 183
183 -
 184
184 -
 185
185 -
 186
186 -
 187
187 -
 188
188 -
 189
189 -
 190
190 -
 191
191 -
 192
192 -
 193
193 -
194
-
195
-
196
-
197
-
198
-
199
-
200
-
201
-
202
-
203
-
204
-
205
-
206
-
207
-
208
-
209
-
210
-
211
-
212
-
213
-
214
-
215
-
216
-
217
-
218
-
219
-
220
-
221
-
222
-
223
-
224
-
225
-
226
-
227
-
228
-
229
-
230
-
231
-
232
-
233
-
234
-
235
-
236
 |
 |

Notes to Consolidated Financial Statements, continued
167
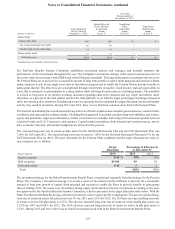
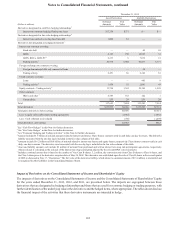
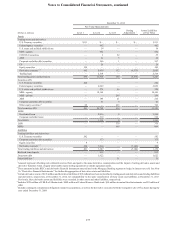
The following tables present the Company's gross derivative financial assets and liabilities at December 31, 2013 and
December 31, 2012, and the related impact of enforceable master netting arrangements, where applicable:
Net Amount
Presented in
Consolidated
Balance Sheets
(Dollars in millions)
Gross
Amount
Amount
Offset
Held/Pledged
Financial
Instruments
Net
Amount
December 31, 2013
Derivative financial assets:
Derivatives subject to master netting arrangement or
similar arrangement $5,285 $4,239 $1,046 $51 $995
Derivatives not subject to master netting arrangement
or similar arrangement 12 — 12 — 12
Exchange traded derivatives 828 502 326 — 326
Total derivative financial assets $6,125 $4,741 $1,384 1$51 $1,333
Derivative financial liabilities:
Derivatives subject to master netting arrangement or
similar arrangement $4,982 $4,646 $336 $13 $323
Derivatives not subject to master netting arrangement
or similar arrangement 189 — 189 — 189
Exchange traded derivatives 502 502 — — —
Total derivative financial liabilities $5,673 $5,148 $525 2$13 $512
December 31, 2012
Derivative financial assets:
Derivatives subject to master netting arrangement or
similar arrangement $8,041 $6,273 $1,768 $94 $1,674
Derivatives not subject to master netting arrangement
or similar arrangement 132 — 132 — 132
Exchange traded derivatives 483 300 183 — 183
Total derivative financial assets $8,656 $6,573 $2,083 1$94 $1,989
Derivative financial liabilities:
Derivatives subject to master netting arrangement or
similar arrangement $7,051 $6,802 $249 $37 $212
Derivatives not subject to master netting arrangement
or similar arrangement 163 — 163 — 163
Exchange traded derivatives 300 300 — — —
Total derivative financial liabilities $7,514 $7,102 $412 2$37 $375
1 At December 31, 2013, $1.4 billion, net of $457 million offsetting cash collateral, is recognized in trading assets and derivatives within the Company's Consolidated
Balance Sheets. At December 31, 2012, $2.1 billion, net of $730 million offsetting cash collateral, is recognized in trading assets and derivatives within the
Company's Consolidated Balance Sheets.
2 At December 31, 2013, $525 million, net of $864 million offsetting cash collateral, is recognized in trading liabilities and derivatives within the Company's
Consolidated Balance Sheets. At December 31, 2012, $412 million, net of $1.3 billion offsetting cash collateral, is recognized in trading liabilities and derivatives
within the Company's Consolidated Balance Sheets.
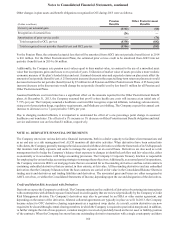
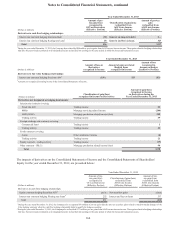
Credit Derivatives
As part of its trading businesses, the Company enters into contracts that are, in form or substance, written guarantees: specifically,
CDS, swap participations, and TRS. The Company accounts for these contracts as derivatives and, accordingly, recognizes these
contracts at fair value, with changes in fair value recognized in trading income in the Consolidated Statements of Income.
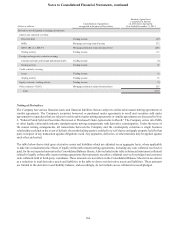
The Company writes CDS, which are agreements under which the Company receives premium payments from its counterparty
for protection against an event of default of a reference asset. In the event of default under the CDS, the Company would either
net cash settle or make a cash payment to its counterparty and take delivery of the defaulted reference asset, from which the
Company may recover all, a portion, or none of the credit loss, depending on the performance of the reference asset. Events of
default, as defined in the CDS agreements, are generally triggered upon the failure to pay and similar events related to the
issuer(s) of the reference asset. At December 31, 2013 and 2012, all written CDS contracts reference single name corporate
credits or corporate credit indices. When the Company has written CDS, it has generally entered into offsetting CDS for the
underlying reference asset, under which the Company paid a premium to its counterparty for protection against an event of
default on the reference asset. The counterparties to these purchased CDS are generally of high creditworthiness and typically
have ISDA master netting agreements in place that subject the CDS to master netting provisions, thereby, mitigating the risk of
non-payment to the Company. As such, at December 31, 2013 the Company did not have any material risk of making a non-
recoverable payment on any written CDS. During 2013 and 2012, the only instances of default on written CDS were driven by
credit indices with constituent credit default. In all cases where the Company made resulting cash payments to settle, the Company