SunTrust 2013 Annual Report Download - page 115
Download and view the complete annual report
Please find page 115 of the 2013 SunTrust annual report below. You can navigate through the pages in the report by either clicking on the pages listed below, or by using the keyword search tool below to find specific information within the annual report.-
 1
1 -
2
-
3
-
4
-
5
-
6
-
7
-
8
-
9
-
10
-
11
-
12
-
13
-
14
-
15
-
16
-
17
-
18
-
19
-
20
-
21
-
22
-
23
-
24
-
25
-
26
-
27
-
28
-
29
-
30
-
31
-
32
-
33
-
34
-
35
-
36
-
37
-
38
-
39
-
40
-
41
-
42
-
43
-
44
-
45
-
46
-
47
-
48
-
49
-
50
-
51
-
52
-
53
-
54
-
55
-
56
-
57
-
58
-
59
-
60
-
61
-
62
-
63
-
64
-
65
-
66
-
67
-
68
-
69
-
70
-
71
-
72
-
73
-
74
-
75
-
76
-
77
-
78
-
79
-
80
-
81
-
82
-
83
-
84
-
85
-
86
-
87
-
88
-
89
-
90
-
91
-
92
-
93
-
94
-
95
-
96
-
97
-
98
-
99
-
100
-
101
-
102
-
103
-
104
-
 105
105 -
 106
106 -
 107
107 -
 108
108 -
 109
109 -
 110
110 -
 111
111 -
 112
112 -
 113
113 -
 114
114 -
 115
115 -
 116
116 -
 117
117 -
 118
118 -
 119
119 -
 120
120 -
 121
121 -
 122
122 -
 123
123 -
 124
124 -
 125
125 -
126
-
127
-
128
-
129
-
130
-
131
-
132
-
133
-
134
-
135
-
136
-
137
-
138
-
139
-
140
-
141
-
142
-
143
-
144
-
145
-
146
-
147
-
148
-
149
-
150
-
151
-
152
-
153
-
154
-
155
-
156
-
157
-
158
-
159
-
160
-
161
-
162
-
163
-
164
-
165
-
166
-
167
-
168
-
169
-
170
-
171
-
172
-
173
-
174
-
175
-
176
-
177
-
178
-
179
-
180
-
181
-
182
-
183
-
184
-
185
-
186
-
187
-
188
-
189
-
190
-
191
-
192
-
193
-
194
-
195
-
196
-
197
-
198
-
199
-
200
-
201
-
202
-
203
-
204
-
205
-
206
-
207
-
208
-
209
-
210
-
211
-
212
-
213
-
214
-
215
-
216
-
217
-
218
-
219
-
220
-
221
-
222
-
223
-
224
-
225
-
226
-
227
-
228
-
229
-
230
-
231
-
232
-
233
-
234
-
235
-
236
 |
 |

99
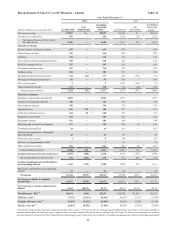
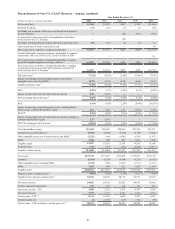
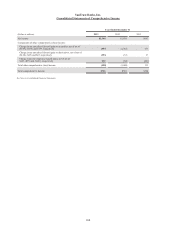
Reconcilement of Non-U.S. GAAP Measures – Quarterly Table 37
Three Months Ended
(Dollars in millions, except
per share data)
2013 2012
December 31 September 30 June 30 March 31 December 31 September 30 June 30 March 31
Net income $426 $189 $377 $352 $356 $1,077 $275 $250
Preferred dividends (10) (9) (9) (9) (4)(2)(3)(3)
Dividends and undistributed
earnings allocated to unvested
shares (3) (1) (3) (3) (2)(9)(2)(2)
Net income available to
common shareholders $413 $179 $365 $340 $350 $1,066 $270 $245
Net income available to
common shareholders,
excluding Form 8-K items1$413 $358 $365 $340 $350 $313 $270 $245
Net income per average
common share, diluted $0.77 $0.33 $0.68 $0.63 $0.65 $1.98 $0.50 $0.46
Impact of Form 8-K items
from the third quarters of 2013
and 2012 — 0.33 — — —(1.40)— —
Diluted net income per share,
excluding Form 8-K items 1$0.77 $0.66 $0.68 $0.63 $0.65 $0.58 $0.50 $0.46
Efficiency ratio 266.82% 90.77% 66.56% 64.46% 65.93% 44.90% 68.83% 69.50%
Impact of excluding
amortization of intangible
assets/impairment of goodwill (0.21) (0.31) (0.29) (0.29) (0.30)(0.43)(0.50)(0.48)
Tangible efficiency ratio 366.61% 90.46% 66.27% 64.17% 65.63% 44.47% 68.33% 69.02%
ROE 7.99% 3.49% 7.12% 6.77% 6.86% 20.84% 5.37% 4.94%
Impact of removing average
intangible assets, excluding
MSRs, from average
shareholders' equity
3.62 1.61 3.23 3.11 3.18 9.67 2.42 2.27
ROTCE 411.61% 5.10% 10.35% 9.88% 10.04% 30.51% 7.79% 7.21%
Total shareholders’ equity $21,422 $21,070 $21,007 $21,194 $20,985 $20,399 $20,568 $20,241
Goodwill, net of deferred
taxes 5(6,183) (6,189) (6,195) (6,200) (6,206)(6,210)(6,220)(6,180)
Other intangible assets, net of
deferred taxes, and MSRs 6(1,332) (1,285) (1,240) (1,071) (949)(888)(929)(1,142)
MSRs 1,300 1,248 1,199 1,025 899 831 865 1,070
Tangible equity 15,207 14,844 14,771 14,948 14,729 14,132 14,284 13,989
Preferred stock (725) (725) (725) (725) (725)(275)(275)(275)
Tangible common equity $14,482 $14,119 $14,046 $14,223 $14,004 $13,857 $14,009 $13,714
Total assets $175,335 $171,777 $171,546 $172,435 $173,442 $173,181 $178,257 $178,226
Goodwill (6,369) (6,369) (6,369) (6,369) (6,369)(6,369)(6,376)(6,344)
Other intangible assets
including MSRs (1,334) (1,287) (1,244) (1,076) (956)(896)(939)(1,155)
MSRs 1,300 1,248 1,199 1,025 899 831 865 1,070
Tangible assets $168,932 $165,369 $165,132 $166,015 $167,016 $166,747 $171,807 $171,797
Tangible equity to tangible
assets 79.00% 8.98% 8.95% 9.00% 8.82% 8.48% 8.31% 8.14%
Tangible book value per
common share 8$27.01 $26.27 $26.08 $26.33 $25.98 $25.72 $26.02 $25.49
Net interest income $1,213 $1,208 $1,211 $1,221 $1,246 $1,271 $1,274 $1,311
Taxable-equivalent adjustment 34 32 31 30 30 30 32 31
Net interest income - FTE 1,247 1,240 1,242 1,251 1,276 1,301 1,306 1,342
Noninterest income 814 680 858 863 1,015 2,542 940 876
Total revenue - FTE 92,061 1,920 2,100 2,114 2,291 3,843 2,246 2,218
Securities gains, net (1) — — (2) (1)(1,941)(14)(18)
Total revenue - FTE excluding
securities gains, net 9$2,060 $1,920 $2,100 $2,112 $2,290 $1,902 $2,232 $2,200
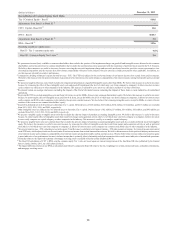
1 We present net income available to common shareholders and diluted net income per share, excluding Form 8-K items. We believe these measures are useful to
investors because it removes the effect of material items impacting the quarters' results and is more reflective of normalized operations as it reflects results that are
primarily client relationship and client transaction driven. Removing these items also allows investors to compare our results to other companies in the industry that
may not have had similar items impacting their results. These measures are utilized by us to measure performance. Additional detail on the items can be found in Form
8-Ks filed with the SEC on October 10, 2013 and September 6, 2012 and in Table 36, "Reconcilement of Non-U.S. GAAP Measures - Annual," in this MD&A.
2Computed by dividing noninterest expense by total revenue - FTE. The FTE basis adjusts for the tax-favored status of net interest income from certain loans and investments. We
believe this measure to be the preferred industry measurement of net interest income and it enhances comparability of net interest income arising from taxable and tax-exempt
sources.