SunTrust 2013 Annual Report Download - page 54
Download and view the complete annual report
Please find page 54 of the 2013 SunTrust annual report below. You can navigate through the pages in the report by either clicking on the pages listed below, or by using the keyword search tool below to find specific information within the annual report.-
 1
1 -
2
-
3
-
4
-
5
-
6
-
7
-
8
-
9
-
10
-
11
-
12
-
13
-
14
-
15
-
16
-
17
-
18
-
19
-
20
-
21
-
22
-
23
-
24
-
25
-
26
-
27
-
28
-
29
-
30
-
31
-
32
-
33
-
34
-
35
-
36
-
37
-
38
-
39
-
40
-
41
-
42
-
43
-
 44
44 -
 45
45 -
 46
46 -
 47
47 -
 48
48 -
 49
49 -
 50
50 -
 51
51 -
 52
52 -
 53
53 -
 54
54 -
 55
55 -
 56
56 -
 57
57 -
 58
58 -
 59
59 -
 60
60 -
 61
61 -
 62
62 -
 63
63 -
 64
64 -
65
-
66
-
67
-
68
-
69
-
70
-
71
-
72
-
73
-
74
-
75
-
76
-
77
-
78
-
79
-
80
-
81
-
82
-
83
-
84
-
85
-
86
-
87
-
88
-
89
-
90
-
91
-
92
-
93
-
94
-
95
-
96
-
97
-
98
-
99
-
100
-
101
-
102
-
103
-
104
-
105
-
106
-
107
-
108
-
109
-
110
-
111
-
112
-
113
-
114
-
115
-
116
-
117
-
118
-
119
-
120
-
121
-
122
-
123
-
124
-
125
-
126
-
127
-
128
-
129
-
130
-
131
-
132
-
133
-
134
-
135
-
136
-
137
-
138
-
139
-
140
-
141
-
142
-
143
-
144
-
145
-
146
-
147
-
148
-
149
-
150
-
151
-
152
-
153
-
154
-
155
-
156
-
157
-
158
-
159
-
160
-
161
-
162
-
163
-
164
-
165
-
166
-
167
-
168
-
169
-
170
-
171
-
172
-
173
-
174
-
175
-
176
-
177
-
178
-
179
-
180
-
181
-
182
-
183
-
184
-
185
-
186
-
187
-
188
-
189
-
190
-
191
-
192
-
193
-
194
-
195
-
196
-
197
-
198
-
199
-
200
-
201
-
202
-
203
-
204
-
205
-
206
-
207
-
208
-
209
-
210
-
211
-
212
-
213
-
214
-
215
-
216
-
217
-
218
-
219
-
220
-
221
-
222
-
223
-
224
-
225
-
226
-
227
-
228
-
229
-
230
-
231
-
232
-
233
-
234
-
235
-
236
 |
 |
38
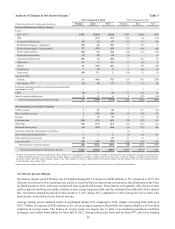
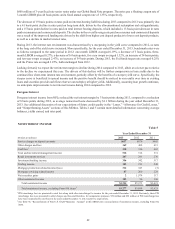
Wholesale Banking reported a 29% increase in net income in 2013 compared to 2012, which was led by decreases in the provision
for credit losses and noninterest expense. Total revenue was lower in 2013 due to lower trading income and leasing asset impairments,
but was partially offset by record investment banking income and a 4% increase in net interest income driven by average loan
growth of 7%. Loan growth was driven by not-for-profit and government lending, core commercial real estate, and our large
corporate lending areas, most notably asset securitization, asset-based lending, and our energy and healthcare industry lending.
Further credit quality improvement in our CRE portfolio in 2013 and the elevated provision in 2012 due to the charge-offs related
to the nonperforming CRE loans sales drove a 70% decrease in the provision for credit losses compared to 2012. Additionally,
noninterest expenses decreased 10% compared to 2012, driven by declines in other real estate and credit related expenses. The
decline in noninterest expense drove further improvements in both the efficiency and tangible efficiency ratios during 2013, which
remained below 55%.
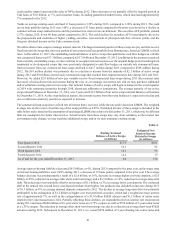
The net loss in Mortgage Banking improved by 18% during 2013 when compared to 2012, driven by an increase in net interest
income and a decrease in the provision for credit losses, partially offset by lower revenue and increased expenses. However, the
results were significantly impacted by the Form 8-K items that reduced income in both years and increased expenses in 2013.
Excluding these Form 8-K items, Mortgage Banking had a more substantial improvement in net loss in 2013 compared to 2012
driven primarily by a moderate decrease in noninterest expense compared to 2012. See Table 36, "Reconcilement of Non-U.S.
GAAP Measures - Annual," for a reconciliation of provision for credit losses, noninterest income, and noninterest expense, excluding
Form 8-K items, including the impact to the Mortgage Banking segment. The decrease in noninterest expense and provision for
credit losses, excluding the Form 8-K items, was the result of improved credit quality and a continued improvement in the operating
environment. Noninterest income, excluding the Form 8-K items, decreased significantly during 2013 compared to 2012 and was
driven by lower current year mortgage revenue due to a decline in production volume and gain on sale margins which were due
to the increase in mortgage rates and a decline in mortgage servicing income driven by lower net MSR hedge performance that
was also a result of higher interest rates. These declines were partially offset by a lower mortgage repurchase provision. As expected,
when interest rates began to rise in 2013 our refinance activity declined, but our home purchase volume increased 16% compared
to 2012. In 2014, we expect further growth in our purchase volume, although it is not expected to offset the decline in refinance
activity expected in 2014. We announced during the fourth quarter of 2013 that we would exit the broker origination channel,
which represented approximately 10% of our loan production in 2013 and approximately 15% in 2012. Additionally, we announced
that we would right-size our mortgage business. As a part of these initiatives, we will reduce our mortgage staff by approximately
800 full-time equivalent employees. These actions are anticipated to be a significant factor in reducing core expenses by
approximately $50 million per quarter. Full realization of this reduction in core expenses is anticipated to be included in Mortgage
Banking results by the second quarter of 2014.
Additional information related to our segments can be found in Note 20, "Business Segment Reporting," to the Consolidated
Financial Statements in this Form 10-K, and further discussion of segment results for the years ended December 31, 2013, 2012,
and 2011, can be found in the "Business Segment Results" section of this MD&A.