SunTrust 2013 Annual Report Download - page 87
Download and view the complete annual report
Please find page 87 of the 2013 SunTrust annual report below. You can navigate through the pages in the report by either clicking on the pages listed below, or by using the keyword search tool below to find specific information within the annual report.-
 1
1 -
2
-
3
-
4
-
5
-
6
-
7
-
8
-
9
-
10
-
11
-
12
-
13
-
14
-
15
-
16
-
17
-
18
-
19
-
20
-
21
-
22
-
23
-
24
-
25
-
26
-
27
-
28
-
29
-
30
-
31
-
32
-
33
-
34
-
35
-
36
-
37
-
38
-
39
-
40
-
41
-
42
-
43
-
44
-
45
-
46
-
47
-
48
-
49
-
50
-
51
-
52
-
53
-
54
-
55
-
56
-
57
-
58
-
59
-
60
-
61
-
62
-
63
-
64
-
65
-
66
-
67
-
68
-
69
-
70
-
71
-
72
-
73
-
74
-
75
-
76
-
 77
77 -
 78
78 -
 79
79 -
 80
80 -
 81
81 -
 82
82 -
 83
83 -
 84
84 -
 85
85 -
 86
86 -
 87
87 -
 88
88 -
 89
89 -
 90
90 -
 91
91 -
 92
92 -
 93
93 -
 94
94 -
 95
95 -
 96
96 -
 97
97 -
98
-
99
-
100
-
101
-
102
-
103
-
104
-
105
-
106
-
107
-
108
-
109
-
110
-
111
-
112
-
113
-
114
-
115
-
116
-
117
-
118
-
119
-
120
-
121
-
122
-
123
-
124
-
125
-
126
-
127
-
128
-
129
-
130
-
131
-
132
-
133
-
134
-
135
-
136
-
137
-
138
-
139
-
140
-
141
-
142
-
143
-
144
-
145
-
146
-
147
-
148
-
149
-
150
-
151
-
152
-
153
-
154
-
155
-
156
-
157
-
158
-
159
-
160
-
161
-
162
-
163
-
164
-
165
-
166
-
167
-
168
-
169
-
170
-
171
-
172
-
173
-
174
-
175
-
176
-
177
-
178
-
179
-
180
-
181
-
182
-
183
-
184
-
185
-
186
-
187
-
188
-
189
-
190
-
191
-
192
-
193
-
194
-
195
-
196
-
197
-
198
-
199
-
200
-
201
-
202
-
203
-
204
-
205
-
206
-
207
-
208
-
209
-
210
-
211
-
212
-
213
-
214
-
215
-
216
-
217
-
218
-
219
-
220
-
221
-
222
-
223
-
224
-
225
-
226
-
227
-
228
-
229
-
230
-
231
-
232
-
233
-
234
-
235
-
236
 |
 |
71
evidenced by a persistently wide bid-ask price range and variability in pricing from the pricing services, particularly for the
vintages and exposures we hold.
As certain markets recover, we are able to reduce our exposure to many of our level 3 instruments through sales, maturities,
or other distributions at prices approximating our previous estimates, thereby corroborating the valuation approaches used.
Many of our remaining level 3 securities, however, will be held until final distribution or maturity. While it is difficult to
accurately predict the ultimate cash value of these securities, we believe the amount that would be ultimately realized if the
securities were held to settlement or maturity will generally be similar to or greater than the current fair value of the securities
classified as level 3. This assessment is based on the current performance of the underlying collateral, which is experiencing
elevated losses but generally not to the degree that correlates to current market values, which reflect downward pressure due
to liquidity issues and other broader macro-economic conditions. It is reasonably likely that market volatility for certain
instruments will continue as a result of a variety of external factors. This lack of liquidity has caused us to evaluate the
performance of the underlying collateral and to use a discount rate commensurate with the rate a market participant would
use to value the instrument in an orderly transaction, but that also acknowledges illiquidity premiums and required investor
rates of return that would be demanded under current market conditions. The discount rate considered the capital structure of
the instrument, market indices, and the relative yields of instruments for which third party pricing information and/or market
activity was available. In certain instances, the interest rate and credit risk components of the valuation indicated a full return
of expected principal and interest; however, the lack of liquidity resulted in wide ranges of discounts in valuing certain level
3 instruments. The illiquidity that continues to persist in certain markets requires discounts of this degree to drive a market
competitive yield, as well as to account for the anticipated extended tenor. The discount rates selected derived reasonable
prices when compared to (i) observable transactions, when available, (ii) other securities on a relative basis, (iii) the bid/ask
spread of non-binding broker indicative bids, and/or (iv) our professional judgment.
All of the techniques used and information obtained in the valuation process provide a range of estimated values, which were
evaluated and compared in order to establish an estimated value that, based on management's judgment, represented a
reasonable estimate of the instrument's fair value. It was not uncommon for the range of value of these instruments to vary
widely; in such cases, we selected an estimated value that we believed was the best indication of value based on the yield a
market participant in this current environment would expect. Due to the continued illiquidity and credit risk of level 3 securities,
these market values are highly sensitive to assumption changes and market volatility. Improvements may be made to our
pricing methodologies on an ongoing basis as observable and relevant information becomes available to us.
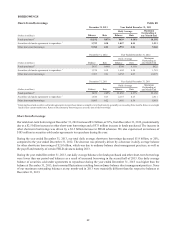
Most derivative instruments are level 1 or level 2 instruments, except for the IRLCs and the Visa litigation related derivative,
which are level 3 instruments. See Note 16, “Derivative Financial Instruments,” to the Consolidated Financial Statements in
this Form 10-K for a detailed discussion regarding derivative contracts and valuation.
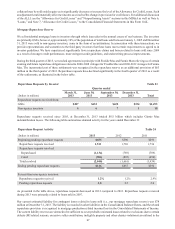
At December 31, 2013, level 3 trading assets and derivatives and level 3 securities AFS totaled $72 million and $953 million,
respectively. Our level 3 securities AFS portfolio included FHLB and Federal Reserve Bank stock, as well as certain municipal
bond securities, some of which are only redeemable with the issuer at par and cannot be traded in the market; as such, no
significant observable market data for these instruments is available. These nonmarketable securities AFS totaled
approximately $752 million at December 31, 2013. The remaining level 3 securities, both trading assets and securities AFS,
are predominantly private ABS and MBS and CDOs, including interests retained from Company-sponsored securitizations
or purchased from third party securitizations. We also have exposure to bank trust preferred CDOs, student loan ABS, and
municipal securities due to our purchase of certain ARS as a result of failed auctions. For all level 3 securities, little or no
market activity exists for either the security or the underlying collateral and therefore, the significant assumptions used to
value the securities are not market observable.
Level 3 trading assets and derivatives decreased by $118 million, or 62%, during the year ended December 31, 2013, primarily
due to sales, paydowns, redemptions, and maturities of securities, partially offset by net unrealized mark-to-market gains and
a small amount of purchases. Level 3 securities AFS increased by $39 million, or 4%, during the year ended December 31,
2013, due primarily to FHLB of Atlanta stock purchases, partially offset by FHLB of Atlanta stock redemptions and continued
paydowns and sales of level 3 securities. During the year ended December 31, 2013, we recognized $122 million in net gains
through earnings related to trading and derivative assets and liabilities classified as level 3, primarily due to $98 million in
IRLC related gains and $24 million in net gains from trading securities. Subsequent to December 31, 2013, we sold a number
of our remaining ARS positions, including all of the CDO securities in trading assets and the municipal securities in securities
AFS, which were valued at $54 million and $20 million, respectively, at December 31, 2013.