SunTrust 2013 Annual Report Download - page 190
Download and view the complete annual report
Please find page 190 of the 2013 SunTrust annual report below. You can navigate through the pages in the report by either clicking on the pages listed below, or by using the keyword search tool below to find specific information within the annual report.-
 1
1 -
2
-
3
-
4
-
5
-
6
-
7
-
8
-
9
-
10
-
11
-
12
-
13
-
14
-
15
-
16
-
17
-
18
-
19
-
20
-
21
-
22
-
23
-
24
-
25
-
26
-
27
-
28
-
29
-
30
-
31
-
32
-
33
-
34
-
35
-
36
-
37
-
38
-
39
-
40
-
41
-
42
-
43
-
44
-
45
-
46
-
47
-
48
-
49
-
50
-
51
-
52
-
53
-
54
-
55
-
56
-
57
-
58
-
59
-
60
-
61
-
62
-
63
-
64
-
65
-
66
-
67
-
68
-
69
-
70
-
71
-
72
-
73
-
74
-
75
-
76
-
77
-
78
-
79
-
80
-
81
-
82
-
83
-
84
-
85
-
86
-
87
-
88
-
89
-
90
-
91
-
92
-
93
-
94
-
95
-
96
-
97
-
98
-
99
-
100
-
101
-
102
-
103
-
104
-
105
-
106
-
107
-
108
-
109
-
110
-
111
-
112
-
113
-
114
-
115
-
116
-
117
-
118
-
119
-
120
-
121
-
122
-
123
-
124
-
125
-
126
-
127
-
128
-
129
-
130
-
131
-
132
-
133
-
134
-
135
-
136
-
137
-
138
-
139
-
140
-
141
-
142
-
143
-
144
-
145
-
146
-
147
-
148
-
149
-
150
-
151
-
152
-
153
-
154
-
155
-
156
-
157
-
158
-
159
-
160
-
161
-
162
-
163
-
164
-
165
-
166
-
167
-
168
-
169
-
170
-
171
-
172
-
173
-
174
-
175
-
176
-
177
-
178
-
179
-
 180
180 -
 181
181 -
 182
182 -
 183
183 -
 184
184 -
 185
185 -
 186
186 -
 187
187 -
 188
188 -
 189
189 -
 190
190 -
 191
191 -
 192
192 -
 193
193 -
 194
194 -
 195
195 -
 196
196 -
 197
197 -
 198
198 -
 199
199 -
 200
200 -
201
-
202
-
203
-
204
-
205
-
206
-
207
-
208
-
209
-
210
-
211
-
212
-
213
-
214
-
215
-
216
-
217
-
218
-
219
-
220
-
221
-
222
-
223
-
224
-
225
-
226
-
227
-
228
-
229
-
230
-
231
-
232
-
233
-
234
-
235
-
236
 |
 |
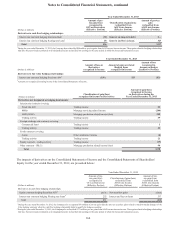
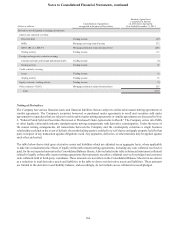
Notes to Consolidated Financial Statements, continued
174
STIS and STRH, broker-dealer affiliates of the Company, use a common third-party clearing broker to clear and execute their
customers' securities transactions and to hold customer accounts. Under their respective agreements, STIS and STRH agree
to indemnify the clearing broker for losses that result from a customer's failure to fulfill its contractual obligations. As the
clearing broker's rights to charge STIS and STRH have no maximum amount, the Company believes that the maximum potential
obligation cannot be estimated. However, to mitigate exposure, the affiliate may seek recourse from the customer through cash
or securities held in the defaulting customers' account. For the years ended December 31, 2013, 2012, and 2011, STIS and
STRH experienced minimal net losses as a result of the indemnity. The clearing agreements expire in May 2015 for both STIS
and STRH.
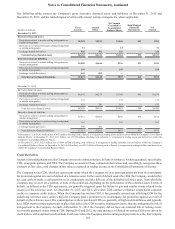
NOTE 18 - FAIR VALUE ELECTION AND MEASUREMENT
The Company carries certain assets and liabilities at fair value on a recurring basis and appropriately classifies them as level
1, 2, or 3 within the fair value hierarchy. The Company’s recurring fair value measurements are based on a requirement to
carry such assets and liabilities at fair value or the Company’s election to carry certain financial assets and liabilities at fair
value. Assets and liabilities that are required to be carried at fair value on a recurring basis include trading securities, securities
AFS, and derivative financial instruments. Assets and liabilities that the Company has elected to carry at fair value on a
recurring basis include certain LHFS and LHFI, MSRs, certain brokered time deposits, and certain issuances of fixed rate
debt.
In certain circumstances, fair value enables a company to more accurately align its financial performance with the economic
value of actively traded or hedged assets or liabilities. Fair value also enables a company to mitigate the non-economic earnings
volatility caused from financial assets and liabilities being carried at different bases of accounting, as well as, to more accurately
portray the active and dynamic management of a company’s balance sheet.
Depending on the nature of the asset or liability, the Company uses various valuation techniques and assumptions in estimating
fair value. The assumptions used to estimate the value of an instrument have varying degrees of impact to the overall fair
value of the asset or liability. This process involves the gathering of multiple sources of information, including broker quotes,
values provided by pricing services, trading activity in other similar securities, market indices, pricing matrices along with
employing various modeling techniques, such as discounted cash flow analyses, in arriving at the best estimate of fair value.
Any model used to produce material financial reporting information is required to have a satisfactory independent review
performed on an annual basis, or more frequently, when significant modifications to the functionality of the model are made.
This review is performed by an internal group that separately reports to the Corporate Risk Function.
The Company has formal processes and controls in place to ensure the appropriateness of all fair value estimates. For fair
values obtained from a third party or those that include certain trader estimates of fair value, there is an internal independent
price validation function within the Finance organization that provides oversight for fair value estimates. For level 2 instruments
and certain level 3 instruments, the validation generally involves evaluating pricing received from two or more other third
party pricing sources that are widely used by market participants. The Company reviews pricing validation information from
both a qualitative and quantitative perspective and determines whether pricing differences exceed acceptable thresholds. If
the pricing differences exceed acceptable thresholds, then the Company reviews differences in valuation approaches used,
which may include contacting a pricing service to gain further information on the valuation of a particular security or class
of securities to determine the ultimate resolution of the pricing variance, which could include an adjustment to the price used
for financial reporting purposes.
The Company classifies instruments as level 2 in the fair value hierarchy if it is able to determine that external pricing sources
are using similar instruments trading in the markets as the basis for estimating fair value. One way the Company determines
this is by the number of pricing services that will provide a quote on the instrument along with the range of values provided
by those pricing services. A wide range of quoted values may indicate that significant adjustments to the trades in the market
are being made by the pricing services. The Company maintains a cross-functional approach if the fair value estimates for
level 3 securities AFS and trading assets and liabilities are internally developed, since the selection of unobservable inputs is
subjective. This cross-functional approach includes input on assumptions not only from the related business unit, but also
from risk management and finance. A consensus of the estimate of the instrument's fair value is reached after evaluating all
available information pertaining to fair value. Inputs, assumptions, and overall conclusions on internally priced level 3
valuations are formally documented on a quarterly basis. This cross-functional approach is limited primarily to the remaining
ARS instruments that are valued internally.