SunTrust 2013 Annual Report Download - page 121
Download and view the complete annual report
Please find page 121 of the 2013 SunTrust annual report below. You can navigate through the pages in the report by either clicking on the pages listed below, or by using the keyword search tool below to find specific information within the annual report.-
 1
1 -
2
-
3
-
4
-
5
-
6
-
7
-
8
-
9
-
10
-
11
-
12
-
13
-
14
-
15
-
16
-
17
-
18
-
19
-
20
-
21
-
22
-
23
-
24
-
25
-
26
-
27
-
28
-
29
-
30
-
31
-
32
-
33
-
34
-
35
-
36
-
37
-
38
-
39
-
40
-
41
-
42
-
43
-
44
-
45
-
46
-
47
-
48
-
49
-
50
-
51
-
52
-
53
-
54
-
55
-
56
-
57
-
58
-
59
-
60
-
61
-
62
-
63
-
64
-
65
-
66
-
67
-
68
-
69
-
70
-
71
-
72
-
73
-
74
-
75
-
76
-
77
-
78
-
79
-
80
-
81
-
82
-
83
-
84
-
85
-
86
-
87
-
88
-
89
-
90
-
91
-
92
-
93
-
94
-
95
-
96
-
97
-
98
-
99
-
100
-
101
-
102
-
103
-
104
-
105
-
106
-
107
-
108
-
109
-
110
-
 111
111 -
 112
112 -
 113
113 -
 114
114 -
 115
115 -
 116
116 -
 117
117 -
 118
118 -
 119
119 -
 120
120 -
 121
121 -
 122
122 -
 123
123 -
 124
124 -
 125
125 -
 126
126 -
 127
127 -
 128
128 -
 129
129 -
 130
130 -
 131
131 -
132
-
133
-
134
-
135
-
136
-
137
-
138
-
139
-
140
-
141
-
142
-
143
-
144
-
145
-
146
-
147
-
148
-
149
-
150
-
151
-
152
-
153
-
154
-
155
-
156
-
157
-
158
-
159
-
160
-
161
-
162
-
163
-
164
-
165
-
166
-
167
-
168
-
169
-
170
-
171
-
172
-
173
-
174
-
175
-
176
-
177
-
178
-
179
-
180
-
181
-
182
-
183
-
184
-
185
-
186
-
187
-
188
-
189
-
190
-
191
-
192
-
193
-
194
-
195
-
196
-
197
-
198
-
199
-
200
-
201
-
202
-
203
-
204
-
205
-
206
-
207
-
208
-
209
-
210
-
211
-
212
-
213
-
214
-
215
-
216
-
217
-
218
-
219
-
220
-
221
-
222
-
223
-
224
-
225
-
226
-
227
-
228
-
229
-
230
-
231
-
232
-
233
-
234
-
235
-
236
 |
 |

105
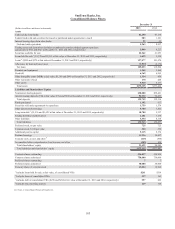
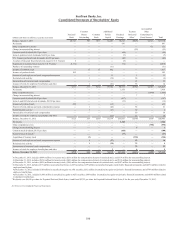
SunTrust Banks, Inc.
Consolidated Balance Sheets
December 31
(Dollars in millions and shares in thousands) 2013 2012
Assets
Cash and due from banks $4,258 $7,134
Federal funds sold and securities borrowed or purchased under agreements to resell 983 1,101
Interest-bearing deposits in other banks 22 22
Cash and cash equivalents 5,263 8,257
Trading assets and derivatives (includes encumbered securities pledged against repurchase
agreements of $731 and $727 at December 31, 2013 and 2012, respectively) 5,040 6,227
Securities available for sale 22,542 21,953
Loans held for sale 1 ($1,378 and $3,243 at fair value at December 31, 2013 and 2012, respectively) 1,699 3,399
Loans 2 ($302 and $379 at fair value at December 31, 2013 and 2012, respectively) 127,877 121,470
Allowance for loan and lease losses (2,044) (2,174)
Net loans 125,833 119,296
Premises and equipment 1,565 1,564
Goodwill 6,369 6,369
Other intangible assets (MSRs at fair value: $1,300 and $899 at December 31, 2013 and 2012, respectively) 1,334 956
Other real estate owned 170 264
Other assets 5,520 5,157
Total assets $175,335 $173,442
Liabilities and Shareholders’ Equity
Noninterest-bearing deposits $38,800 $39,481
Interest-bearing deposits (CDs at fair value: $764 and $832 at December 31, 2013 and 2012, respectively) 90,959 92,835
Total deposits 129,759 132,316
Funds purchased 1,192 617
Securities sold under agreements to repurchase 1,759 1,574
Other short-term borrowings 5,788 3,303
Long-term debt 3 ($1,556 and $1,622 at fair value at December 31, 2013 and 2012, respectively) 10,700 9,357
Trading liabilities and derivatives 1,181 1,176
Other liabilities 3,534 4,114
Total liabilities 153,913 152,457
Preferred stock, no par value 725 725
Common stock, $1.00 par value 550 550
Additional paid in capital 9,115 9,174
Retained earnings 11,936 10,817
Treasury stock, at cost, and other 4(615) (590)
Accumulated other comprehensive (loss)/income, net of tax (289) 309
Total shareholders’ equity 21,422 20,985
Total liabilities and shareholders’ equity $175,335 $173,442
Common shares outstanding 536,097 538,959
Common shares authorized 750,000 750,000
Preferred shares outstanding 77
Preferred shares authorized 50,000 50,000
Treasury shares of common stock 13,824 10,962
1 Includes loans held for sale, at fair value, of consolidated VIEs $261 $319
2 Includes loans of consolidated VIEs 327 365
3 Includes debt of consolidated VIEs ($256 and $286 at fair value at December 31, 2013 and 2012, respectively) 597 666
4 Includes noncontrolling interest 119 114
See Notes to Consolidated Financial Statements.