SunTrust 2013 Annual Report Download - page 139
Download and view the complete annual report
Please find page 139 of the 2013 SunTrust annual report below. You can navigate through the pages in the report by either clicking on the pages listed below, or by using the keyword search tool below to find specific information within the annual report.-
 1
1 -
2
-
3
-
4
-
5
-
6
-
7
-
8
-
9
-
10
-
11
-
12
-
13
-
14
-
15
-
16
-
17
-
18
-
19
-
20
-
21
-
22
-
23
-
24
-
25
-
26
-
27
-
28
-
29
-
30
-
31
-
32
-
33
-
34
-
35
-
36
-
37
-
38
-
39
-
40
-
41
-
42
-
43
-
44
-
45
-
46
-
47
-
48
-
49
-
50
-
51
-
52
-
53
-
54
-
55
-
56
-
57
-
58
-
59
-
60
-
61
-
62
-
63
-
64
-
65
-
66
-
67
-
68
-
69
-
70
-
71
-
72
-
73
-
74
-
75
-
76
-
77
-
78
-
79
-
80
-
81
-
82
-
83
-
84
-
85
-
86
-
87
-
88
-
89
-
90
-
91
-
92
-
93
-
94
-
95
-
96
-
97
-
98
-
99
-
100
-
101
-
102
-
103
-
104
-
105
-
106
-
107
-
108
-
109
-
110
-
111
-
112
-
113
-
114
-
115
-
116
-
117
-
118
-
119
-
120
-
121
-
122
-
123
-
124
-
125
-
126
-
127
-
128
-
 129
129 -
 130
130 -
 131
131 -
 132
132 -
 133
133 -
 134
134 -
 135
135 -
 136
136 -
 137
137 -
 138
138 -
 139
139 -
 140
140 -
 141
141 -
 142
142 -
 143
143 -
 144
144 -
 145
145 -
 146
146 -
 147
147 -
 148
148 -
 149
149 -
150
-
151
-
152
-
153
-
154
-
155
-
156
-
157
-
158
-
159
-
160
-
161
-
162
-
163
-
164
-
165
-
166
-
167
-
168
-
169
-
170
-
171
-
172
-
173
-
174
-
175
-
176
-
177
-
178
-
179
-
180
-
181
-
182
-
183
-
184
-
185
-
186
-
187
-
188
-
189
-
190
-
191
-
192
-
193
-
194
-
195
-
196
-
197
-
198
-
199
-
200
-
201
-
202
-
203
-
204
-
205
-
206
-
207
-
208
-
209
-
210
-
211
-
212
-
213
-
214
-
215
-
216
-
217
-
218
-
219
-
220
-
221
-
222
-
223
-
224
-
225
-
226
-
227
-
228
-
229
-
230
-
231
-
232
-
233
-
234
-
235
-
236
 |
 |

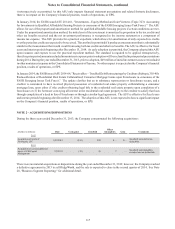
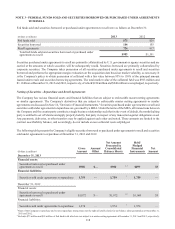
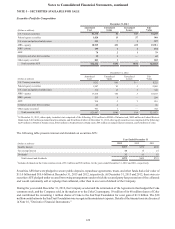
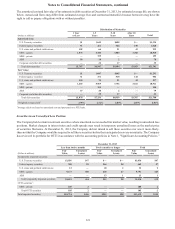
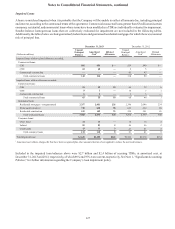
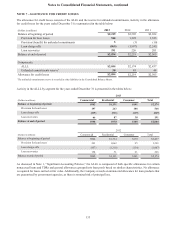
Notes to Consolidated Financial Statements, continued
123
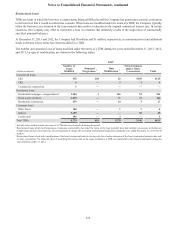
The securities that gave rise to credit impairments recognized during the years ended December 31, 2013, 2012, and 2011, as
shown in the table below, consisted of private MBS and ABS with a fair value of approximately $22 million, $209 million,
and $167 million, respectively.
Year Ended December 31
(Dollars in millions) 2013 2012 2011
OTTI1$— $1 $2
Portion of gains/(losses) recognized in OCI (before taxes) 164
Net impairment losses recognized in earnings $1 $7 $6
1 The initial OTTI amount represents the excess of the amortized cost over the fair value of AFS debt securities. For subsequent impairments of the same
security, amount includes additional declines in the fair value subsequent to the previously recorded OTTI, if applicable, until such time the security is no
longer in an unrealized loss position.
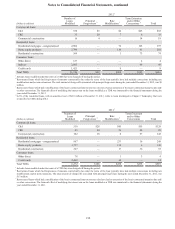
The following is a rollforward of credit losses recognized in earnings for the years ended December 31, 2013, 2012, and 2011,
related to securities for which the Company does not intend to sell and it is not more-likely-than-not that the Company will
be required to sell as of the end of each period presented. Subsequent credit losses may be recorded on securities without a
corresponding further decline in fair value when there has been a decline in expected cash flows.
Year Ended December 31
(Dollars in millions) 2013 2012 2011
Balance, beginning of period $31 $25 $20
Additions:
OTTI credit losses on previously impaired securities 176
Reductions:
Credit impaired securities sold, matured, or written off (6) ——
Increases in expected cash flows recognized over the remaining life of the securities (1) (1) (1)
Balance, end of period $25 $31 $25
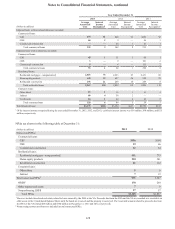
The following table presents a summary of the significant inputs used in determining the measurement of credit losses
recognized in earnings for private MBS and ABS for the year ended December 31:
2013 2012 2011
Default rate 2 - 9% 2 - 9% 4 - 8%
Prepayment rate 7 - 21% 7 - 21% 12 - 22%
Loss severity 46 - 74% 40 - 56% 39 - 46%
Assumption ranges represent the lowest and highest lifetime average estimates of each security for which credit losses were
recognized in earnings. Ranges may vary from period to period as the securities for which credit losses are recognized vary.
Additionally, severity may vary widely when losses are few and large.