SunTrust 2013 Annual Report Download - page 135
Download and view the complete annual report
Please find page 135 of the 2013 SunTrust annual report below. You can navigate through the pages in the report by either clicking on the pages listed below, or by using the keyword search tool below to find specific information within the annual report.-
 1
1 -
2
-
3
-
4
-
5
-
6
-
7
-
8
-
9
-
10
-
11
-
12
-
13
-
14
-
15
-
16
-
17
-
18
-
19
-
20
-
21
-
22
-
23
-
24
-
25
-
26
-
27
-
28
-
29
-
30
-
31
-
32
-
33
-
34
-
35
-
36
-
37
-
38
-
39
-
40
-
41
-
42
-
43
-
44
-
45
-
46
-
47
-
48
-
49
-
50
-
51
-
52
-
53
-
54
-
55
-
56
-
57
-
58
-
59
-
60
-
61
-
62
-
63
-
64
-
65
-
66
-
67
-
68
-
69
-
70
-
71
-
72
-
73
-
74
-
75
-
76
-
77
-
78
-
79
-
80
-
81
-
82
-
83
-
84
-
85
-
86
-
87
-
88
-
89
-
90
-
91
-
92
-
93
-
94
-
95
-
96
-
97
-
98
-
99
-
100
-
101
-
102
-
103
-
104
-
105
-
106
-
107
-
108
-
109
-
110
-
111
-
112
-
113
-
114
-
115
-
116
-
117
-
118
-
119
-
120
-
121
-
122
-
123
-
124
-
 125
125 -
 126
126 -
 127
127 -
 128
128 -
 129
129 -
 130
130 -
 131
131 -
 132
132 -
 133
133 -
 134
134 -
 135
135 -
 136
136 -
 137
137 -
 138
138 -
 139
139 -
 140
140 -
 141
141 -
 142
142 -
 143
143 -
 144
144 -
 145
145 -
146
-
147
-
148
-
149
-
150
-
151
-
152
-
153
-
154
-
155
-
156
-
157
-
158
-
159
-
160
-
161
-
162
-
163
-
164
-
165
-
166
-
167
-
168
-
169
-
170
-
171
-
172
-
173
-
174
-
175
-
176
-
177
-
178
-
179
-
180
-
181
-
182
-
183
-
184
-
185
-
186
-
187
-
188
-
189
-
190
-
191
-
192
-
193
-
194
-
195
-
196
-
197
-
198
-
199
-
200
-
201
-
202
-
203
-
204
-
205
-
206
-
207
-
208
-
209
-
210
-
211
-
212
-
213
-
214
-
215
-
216
-
217
-
218
-
219
-
220
-
221
-
222
-
223
-
224
-
225
-
226
-
227
-
228
-
229
-
230
-
231
-
232
-
233
-
234
-
235
-
236
 |
 |

Notes to Consolidated Financial Statements, continued
119
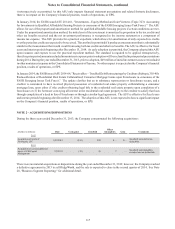
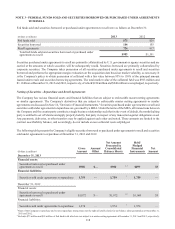
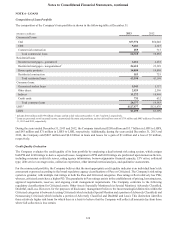
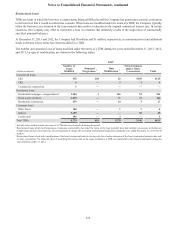
NOTE 4 - TRADING ASSETS AND LIABILITIES AND DERIVATIVES
The fair values of the components of trading assets and liabilities and derivatives at December 31 were as follows:
(Dollars in millions) 2013 2012
Trading Assets and Derivatives:
U.S. Treasury securities $219 $111
Federal agency securities 426 462
U.S. states and political subdivisions 65 34
MBS - agency 323 432
CDO/CLO securities 57 55
ABS 636
Corporate and other debt securities 534 567
CP 29 28
Equity securities 109 100
Derivatives 1, 2 1,384 2,083
Trading loans 31,888 2,319
Total trading assets and derivatives $5,040 $6,227
Trading Liabilities and Derivatives:
U.S. Treasury securities $472 $582
Corporate and other debt securities 179 173
Equity securities 59
Derivatives 1, 2 525 412
Total trading liabilities and derivatives $1,181 $1,176
1 Certain derivative assets of $37 million and derivative liabilities of $49 million are presented in trading assets and derivatives and trading liabilities and
derivatives, respectively, at December 31, 2013. Previously, these derivative assets and liabilities were presented in other assets and other liabilities,
respectively, in the Consolidated Balance Sheets. For comparative purposes, $178 million of derivative assets and $15 million of derivative liabilities have
been reclassified to trading assets and derivatives and trading liabilities and derivatives, respectively, at December 31, 2012.
2 Amounts include the impact of offsetting cash collateral received from and paid to the same derivative counterparties and the impact of netting derivative
assets and derivative liabilities when a legally enforceable master netting agreement or similar agreement exists.
3 Includes loans related to TRS.
Various trading products and derivative instruments are used as part of the Company’s overall balance sheet management
strategies and to support client requirements executed through the Bank and/or its broker/dealer subsidiary. The Company
manages the potential market volatility associated with the trading instruments that are utilized for balance sheet management
with appropriate risk management strategies. The size, volume, and nature of the trading products and derivative instruments
can vary based on economic, client specific, and Company specific asset or liability conditions. Product offerings to clients
include debt securities, loans traded in the secondary market, equity securities, derivative and foreign exchange contracts, and
similar financial instruments. Other trading-related activities include acting as a market maker in certain debt and equity
securities and related derivatives. The Company also uses end user derivatives to manage interest rate and market risk from
non-trading activities. The Company has policies and procedures to manage market risk associated with client trading activities
as well as non-trading activities and assumes a limited degree of market risk by managing the size and nature of its exposure.
The Company has pledged $731 million and $727 million of certain trading securities to secure $717 million and $703 million
of repurchase agreements at December 31, 2013 and 2012, respectively. Additionally, the Company has pledged $97 million
and $86 million of certain trading securities to secure certain derivative agreements at December 31, 2013 and 2012,
respectively.