SunTrust 2013 Annual Report Download - page 62
Download and view the complete annual report
Please find page 62 of the 2013 SunTrust annual report below. You can navigate through the pages in the report by either clicking on the pages listed below, or by using the keyword search tool below to find specific information within the annual report.-
 1
1 -
2
-
3
-
4
-
5
-
6
-
7
-
8
-
9
-
10
-
11
-
12
-
13
-
14
-
15
-
16
-
17
-
18
-
19
-
20
-
21
-
22
-
23
-
24
-
25
-
26
-
27
-
28
-
29
-
30
-
31
-
32
-
33
-
34
-
35
-
36
-
37
-
38
-
39
-
40
-
41
-
42
-
43
-
44
-
45
-
46
-
47
-
48
-
49
-
50
-
51
-
 52
52 -
 53
53 -
 54
54 -
 55
55 -
 56
56 -
 57
57 -
 58
58 -
 59
59 -
 60
60 -
 61
61 -
 62
62 -
 63
63 -
 64
64 -
 65
65 -
 66
66 -
 67
67 -
 68
68 -
 69
69 -
 70
70 -
 71
71 -
 72
72 -
73
-
74
-
75
-
76
-
77
-
78
-
79
-
80
-
81
-
82
-
83
-
84
-
85
-
86
-
87
-
88
-
89
-
90
-
91
-
92
-
93
-
94
-
95
-
96
-
97
-
98
-
99
-
100
-
101
-
102
-
103
-
104
-
105
-
106
-
107
-
108
-
109
-
110
-
111
-
112
-
113
-
114
-
115
-
116
-
117
-
118
-
119
-
120
-
121
-
122
-
123
-
124
-
125
-
126
-
127
-
128
-
129
-
130
-
131
-
132
-
133
-
134
-
135
-
136
-
137
-
138
-
139
-
140
-
141
-
142
-
143
-
144
-
145
-
146
-
147
-
148
-
149
-
150
-
151
-
152
-
153
-
154
-
155
-
156
-
157
-
158
-
159
-
160
-
161
-
162
-
163
-
164
-
165
-
166
-
167
-
168
-
169
-
170
-
171
-
172
-
173
-
174
-
175
-
176
-
177
-
178
-
179
-
180
-
181
-
182
-
183
-
184
-
185
-
186
-
187
-
188
-
189
-
190
-
191
-
192
-
193
-
194
-
195
-
196
-
197
-
198
-
199
-
200
-
201
-
202
-
203
-
204
-
205
-
206
-
207
-
208
-
209
-
210
-
211
-
212
-
213
-
214
-
215
-
216
-
217
-
218
-
219
-
220
-
221
-
222
-
223
-
224
-
225
-
226
-
227
-
228
-
229
-
230
-
231
-
232
-
233
-
234
-
235
-
236
 |
 |
46
remain consistent with the carrying values of the remaining properties to be sold, and as such, no additional valuation
adjustments are currently anticipated.
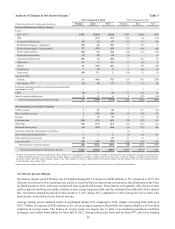
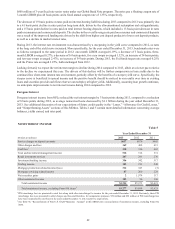
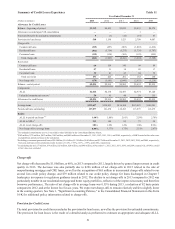
PROVISION FOR INCOME TAXES
The provision for income taxes includes both federal and state income taxes. For the year ended December 31, 2013, the
provision for income taxes was $273 million, resulting in an effective tax rate of 16.9%. For the year ended December 31,
2012, the provision for income taxes was $773 million, resulting in an effective tax rate of 28.3%. The provision for income
taxes differs from the provision using statutory rates primarily due to favorable permanent tax items such as income from
lending to tax exempt entities and federal tax credits from community reinvestment activities. The decrease in the effective
tax rate for the year ended December 31, 2013 was primarily due to lower pre-tax earnings as well as the tax benefit realized
on the taxable reorganization of certain subsidiaries. This tax benefit was partially offset by an increase in STM’s valuation
allowance related to its DTAs for certain state NOLs and an increase in the liability for UTBs. See Note 14, “Income Taxes,”
to the Consolidated Financial Statements in this Form 10-K for further information related to the provision for income taxes.
Excluding the impact of Form 8-K items related to 2013 and 2012, the effective tax rate was 27.4% and 22.9%, for the years
ended December 31, 2013 and 2012, respectively. The increase in the effective tax rate during the year ended December 31,
2013, was primarily attributable to higher pre-tax income. See Table 36, "Reconcilement of Non-U.S. GAAP Measures -
Annual," in this MD&A for a reconciliation of the effective tax rate excluding Form 8-K items.
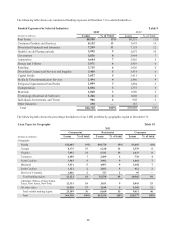
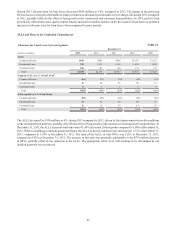
LOANS
Our disclosures about the credit quality of our loan portfolio and the related credit reserves (i) describe the nature of credit
risk inherent in our loan portfolio, (ii) provide information on how we analyze and assess credit risk in arriving at an adequate
and appropriate ALLL, and (iii) explain the changes in the ALLL and reasons for those changes.
We report our loan portfolio in three segments: commercial, residential, and consumer. Loans are assigned to these segments
based upon the type of borrower, purpose, collateral, and/or our underlying credit management processes. Additionally, within
each segment, we have identified loan types, which further disaggregate loans based upon common risk characteristics.
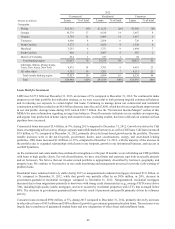
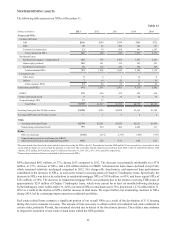
Commercial
The C&I loan type includes loans to fund business operations or activities, corporate credit cards, loans secured by owner-
occupied properties, and other wholesale lending activities. CRE and commercial construction loan types are based on investor
exposures where repayment is largely dependent upon the operation, refinance, or sale of the underlying real estate. Commercial
and construction loans secured by owner-occupied properties are classified as C&I loans, as the primary source of loan
repayment for owner-occupied properties is business income and not real estate operations.
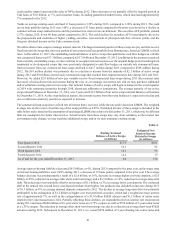
Residential
Residential mortgages consist of loans secured by 1-4 family homes, mostly prime first-lien loans, both government-guaranteed
and nonguaranteed. Residential construction loans include owner-occupied residential lot loans and construction-to-perm
loans. Home equity products consist of equity lines of credit and closed-end equity loans that may be in either a first lien or
junior lien position. At December 31, 2013, 37% of our home equity products were in a first lien position and 63% were in
a junior lien position. For home equity products in a junior lien position, we own or service 29% of the loans that are senior
to the home equity product.
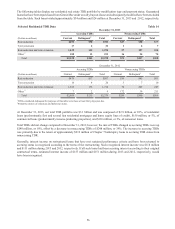
Only a small percentage of home equity lines are scheduled to end their draw period and convert to an amortizing term loan
during 2014, with 92% of home equity line balances scheduled to convert to amortization in 2015 or later and 62% in 2017
or later. Historically, a majority of accounts have not converted to amortization. Based on historical trends, within 12 months
of the end of their draw period, approximately 80% of accounts, and approximately 68% of accounts with a balance, are
closed or refinanced. We perform credit management activities on home equity accounts to limit our loss exposure. These
activities result in the suspension of available credit of most home equity junior lien accounts when the first lien position is
delinquent, including when the junior lien is still current. We monitor the delinquency status of first mortgages serviced by
other parties. Additionally, we actively monitor refreshed credit bureau scores of borrowers with junior liens, as these scores
are highly sensitive to first lien mortgage delinquency. At December 31, 2013, our home equity junior lien loss severity was
approximately 87%. At December 31, 2013, the average FICO score related to loans in our home equity portfolio was 760
and the average outstanding loan size was approximately $48,000.